Catalog
With stdpopsim, you can run simulations from a number of demographic models
that were implemented from published demographic histories. These models have been
rigorously checked and tested by multiple people, so you can rest easy knowing that
your simulations are reproducible and bug-free!
This catalog shows you all of the possible options that you can use to configure
your simulation.
It is organised around a number of choices that you’ll need to make about the
Species you wish to simulate:
Which chromosome (
Genomeobject)?Which recombination/genetic map (
GeneticMapobject)?Which model of demographic history (
DemographicModelobject)?Which distribution of fitness effects (
DFEobject) withinwhich annotation track (
Annotationobject)?
For instance, suppose you are interested in simulating modern human samples of
chromosome 22, using
the HapMapII genetic map, under
a 3-population Out-of-Africa model, with
background selection acting within
exons from the Ensembl Havana 104 annotations.
The following command simulates 2 samples from each of the three populations,
(named YRI, CEU, and CHB) and saves the output to a file called test.trees:
$ stdpopsim -e slim HomSap -c chr22 -o test.trees -g HapMapII_GRCh38 \
$    --dfe Gamma_K17 --dfe-annotation ensembl_havana_104_exons \
$    -d OutOfAfrica_3G09 YRI:2 CEU:2 CHB:2
(To learn more about using stdpopsim via the command-line, read our
tutorial about it.)
Are there other well-known organisms, genetic maps or models that
you’d like to see in stdpopsim? Head to our Development
page to learn about the process for adding new items to the catalog.
Then, if you feel ready, make an issue on our
GitHub page.
Aedes aegypti
- ID:
AedAeg
- Name:
Aedes aegypti
- Common name:
Yellow fever mosquito
- Generation time:
0.06666666666666667 (Crawford et al., 2017)
- Ploidy:
2
- Population size:
1000000.0 (Crawford et al., 2017)
Genome
- Genome assembly name:
AaegL5
ID |
Ploidy |
Length |
Recombination rate |
Mutation rate |
|---|---|---|---|---|
1 |
2 |
310827022 |
3.06e-09 |
3.5e-09 |
2 |
2 |
474425716 |
2.49e-09 |
3.5e-09 |
3 |
2 |
409777670 |
2.91e-09 |
3.5e-09 |
MT |
1 |
16790 |
0 |
3.5e-09 |
Mutation and recombination rates are in units of per bp and per generation.
Anas platyrhynchos
- ID:
AnaPla
- Name:
Anas platyrhynchos
- Common name:
Mallard
- Generation time:
- Ploidy:
2
- Population size:
156000 (Guo et al., 2021)
Genome
- Genome assembly name:
ASM874695v1
ID |
Ploidy |
Length |
Recombination rate |
Mutation rate |
|---|---|---|---|---|
1 |
2 |
208326429 |
1.52e-08 |
4.83e-09 |
2 |
2 |
162939446 |
1.39e-08 |
4.83e-09 |
3 |
2 |
119723720 |
9.38e-09 |
4.83e-09 |
4 |
2 |
77626585 |
1.2e-08 |
4.83e-09 |
5 |
2 |
64988622 |
1.21e-08 |
4.83e-09 |
6 |
2 |
39543408 |
3.04e-08 |
4.83e-09 |
7 |
2 |
37812880 |
2.59e-08 |
4.83e-09 |
8 |
2 |
33348632 |
1.28e-08 |
4.83e-09 |
9 |
2 |
26742597 |
1.34e-08 |
4.83e-09 |
10 |
2 |
22933227 |
2.5e-08 |
4.83e-09 |
11 |
2 |
22193879 |
1.5e-08 |
4.83e-09 |
12 |
2 |
22338721 |
3.15e-08 |
4.83e-09 |
13 |
2 |
21714986 |
1.41e-08 |
4.83e-09 |
14 |
2 |
20320564 |
8.61e-09 |
4.83e-09 |
15 |
2 |
18227546 |
3.79e-09 |
4.83e-09 |
16 |
2 |
16053328 |
3.86e-09 |
4.83e-09 |
17 |
2 |
15319648 |
3.13e-09 |
4.83e-09 |
18 |
2 |
13333155 |
1.58e-09 |
4.83e-09 |
19 |
2 |
12198306 |
1.43e-08 |
4.83e-09 |
20 |
2 |
12091001 |
1.43e-08 |
4.83e-09 |
21 |
2 |
8553409 |
1.43e-08 |
4.83e-09 |
22 |
2 |
16160689 |
1.43e-08 |
4.83e-09 |
23 |
2 |
7977799 |
1.43e-08 |
4.83e-09 |
24 |
2 |
7737077 |
1.43e-08 |
4.83e-09 |
25 |
2 |
7574731 |
1.43e-08 |
4.83e-09 |
26 |
2 |
6918023 |
1.43e-08 |
4.83e-09 |
27 |
2 |
6270716 |
1.43e-08 |
4.83e-09 |
28 |
2 |
5960150 |
1.43e-08 |
4.83e-09 |
29 |
2 |
1456683 |
1.43e-08 |
4.83e-09 |
30 |
2 |
1872559 |
1.43e-08 |
4.83e-09 |
Z |
2 |
81233375 |
1.43e-08 |
4.83e-09 |
31 |
2 |
2637124 |
1.43e-08 |
4.83e-09 |
32 |
2 |
3473573 |
1.43e-08 |
4.83e-09 |
33 |
2 |
2151773 |
1.43e-08 |
4.83e-09 |
34 |
2 |
7214884 |
1.43e-08 |
4.83e-09 |
35 |
2 |
5548691 |
1.43e-08 |
4.83e-09 |
36 |
2 |
3997205 |
1.43e-08 |
4.83e-09 |
37 |
2 |
3148754 |
1.43e-08 |
4.83e-09 |
38 |
2 |
2836164 |
1.43e-08 |
4.83e-09 |
39 |
2 |
2018729 |
1.43e-08 |
4.83e-09 |
40 |
2 |
1354177 |
1.43e-08 |
4.83e-09 |
Mutation and recombination rates are in units of per bp and per generation.
Demographic Models
ID |
Description |
|---|---|
North American Mallard/Black Duck split |
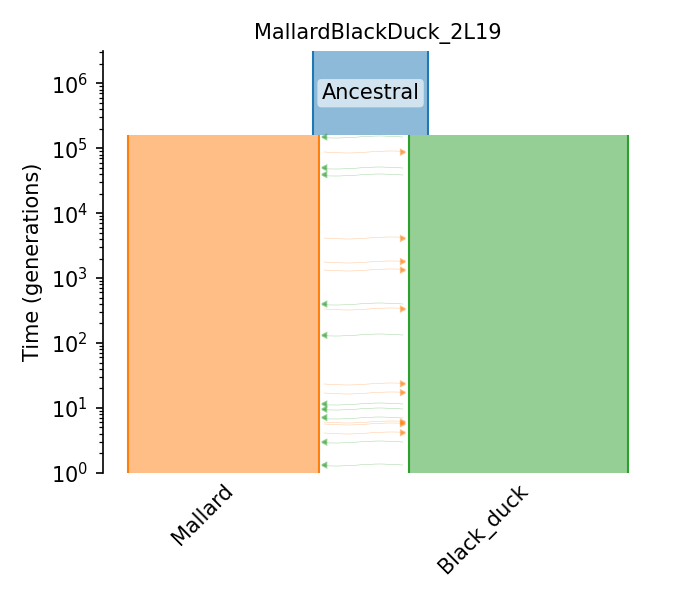
North American Mallard/Black Duck split
This is a model fit to contemporary samples of wild North American mallard and black duck, using the “split-migration” model of dadi. See Figure 6 of Lavretsky et al 2019.
Details
- ID:
MallardBlackDuck_2L19
- Description:
North American Mallard/Black Duck split
- Num populations:
3
Populations
Index |
ID |
Sampling time |
Description |
|---|---|---|---|
0 |
Mallard |
None |
Wild North American mallards |
1 |
Black_duck |
None |
Wild black ducks |
2 |
Ancestral |
158076.25 |
Ancestral population |
Citations
Lavretsky et al., 2019. https://doi.org/10.1111/mec.15343
Demographic Model parameters
Parameter Type (units) |
Value |
Description |
|---|---|---|
Population size |
819,535 |
Ancestral pop. size |
Population size |
1,570,000 |
Mallard pop. size |
Population size |
1,370,000 |
Black duck pop. size |
Migration rate (x10^-6 per gen.) |
1.72 |
Black-Mallard migration rate |
Migration rate (x10^-6 per gen.) |
1.72 |
Mallard-Black migration rate |
Epoch Time (gen.) |
158076 |
Mallard/Black split time |
Generation time (yrs.) |
4 |
Generation time |
Mutation rate (subst/gen) |
4.83e-9 |
Mutation rate |
Anolis carolinensis
- ID:
AnoCar
- Name:
Anolis carolinensis
- Common name:
Anole lizard
- Generation time:
1.5 (Lovern et al., 2004)
- Ploidy:
2
- Population size:
3050000.0 (Pombi et al., 2019)
Genome
- Genome assembly name:
AnoCar2.0
ID |
Ploidy |
Length |
Recombination rate |
Mutation rate |
|---|---|---|---|---|
1 |
2 |
263920458 |
1.59e-08 |
2.1e-10 |
2 |
2 |
199619895 |
1.59e-08 |
2.1e-10 |
3 |
2 |
204416410 |
1.59e-08 |
2.1e-10 |
4 |
2 |
156502444 |
1.59e-08 |
2.1e-10 |
5 |
2 |
150641573 |
1.59e-08 |
2.1e-10 |
6 |
2 |
80741955 |
1.59e-08 |
2.1e-10 |
LGa |
2 |
7025928 |
1.59e-08 |
2.1e-10 |
LGb |
2 |
3271537 |
1.59e-08 |
2.1e-10 |
LGc |
2 |
9478905 |
1.59e-08 |
2.1e-10 |
LGd |
2 |
1094478 |
1.59e-08 |
2.1e-10 |
LGf |
2 |
4257874 |
1.59e-08 |
2.1e-10 |
LGg |
2 |
424765 |
1.59e-08 |
2.1e-10 |
LGh |
2 |
248369 |
1.59e-08 |
2.1e-10 |
MT |
1 |
17223 |
0 |
2.1e-10 |
Mutation and recombination rates are in units of per bp and per generation.
Anopheles gambiae
- ID:
AnoGam
- Name:
Anopheles gambiae
- Common name:
Anopheles gambiae
- Generation time:
0.09090909090909091 (Ag1000G Consortium, 2017)
- Ploidy:
2
- Population size:
1000000.0 (Ag1000G Consortium, 2017)
Genome
- Genome assembly name:
AgamP4
ID |
Ploidy |
Length |
Recombination rate |
Mutation rate |
|---|---|---|---|---|
2L |
2 |
49364325 |
1.3e-08 |
3.5e-09 |
2R |
2 |
61545105 |
1.3e-08 |
3.5e-09 |
3L |
2 |
41963435 |
1.3e-08 |
3.5e-09 |
3R |
2 |
53200684 |
1.6e-08 |
3.5e-09 |
X |
2 |
24393108 |
2.04e-08 |
3.5e-09 |
Mt |
1 |
15363 |
0 |
3.5e-09 |
Mutation and recombination rates are in units of per bp and per generation.
Demographic Models
ID |
Description |
|---|---|
Stairwayplot estimates of N(t) for Gabon sample |
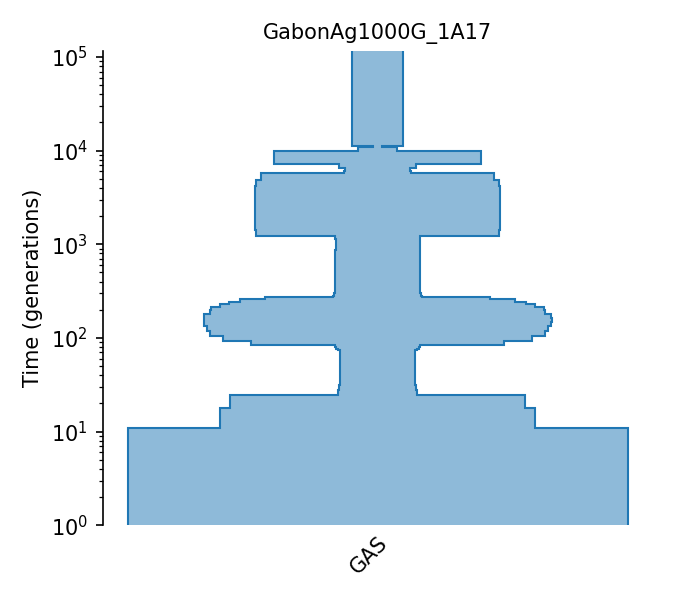
Stairwayplot estimates of N(t) for Gabon sample
These estimates were done as part of the Ag1000G 2017 Consortium paper. Stairwayplot was run with the addition of a misorientation parameter using SFS information from each population. The model contains 110 distinct epochs, so only some summaries are reported in the population table.
Details
- ID:
GabonAg1000G_1A17
- Description:
Stairwayplot estimates of N(t) for Gabon sample
- Num populations:
1
Populations
Index |
ID |
Sampling time |
Description |
|---|---|---|---|
0 |
GAS |
0 |
Gabon gambiae population |
Citations
Ag1000G Consortium, 2017. https://doi.org/10.1038/nature24995
Demographic Model parameters
Parameter Type (units) |
Value |
Description |
|---|---|---|
Population size |
4,069,863 |
Modern population size |
Population size |
205,766 |
Mean coalescence time / 4 |
Generation time (yrs.) |
1/11 |
Generation time |
Mutation rate (subst/gen) |
3.5e-9 |
Mutation rate |
Apis mellifera
- ID:
ApiMel
- Name:
Apis mellifera
- Common name:
Apis mellifera (DH4)
- Generation time:
- Ploidy:
2
- Population size:
200000.0 (Wallberg et al., 2014)
Genome
- Genome assembly name:
Amel_HAv3.1
ID |
Ploidy |
Length |
Recombination rate |
Mutation rate |
|---|---|---|---|---|
CM009931.2 |
2 |
27754200 |
2.39e-07 |
3.4e-09 |
CM009932.2 |
2 |
16089512 |
2.46e-07 |
3.4e-09 |
CM009933.2 |
2 |
13619445 |
2.41e-07 |
3.4e-09 |
CM009934.2 |
2 |
13404451 |
2.76e-07 |
3.4e-09 |
CM009935.2 |
2 |
13896941 |
2.14e-07 |
3.4e-09 |
CM009936.2 |
2 |
17789102 |
2.12e-07 |
3.4e-09 |
CM009937.2 |
2 |
14198698 |
2.34e-07 |
3.4e-09 |
CM009938.2 |
2 |
12717210 |
2.09e-07 |
3.4e-09 |
CM009939.2 |
2 |
12354651 |
2.46e-07 |
3.4e-09 |
CM009940.2 |
2 |
12360052 |
2.48e-07 |
3.4e-09 |
CM009941.2 |
2 |
16352600 |
2.03e-07 |
3.4e-09 |
CM009942.2 |
2 |
11514234 |
2.12e-07 |
3.4e-09 |
CM009943.2 |
2 |
11279722 |
2.34e-07 |
3.4e-09 |
CM009944.2 |
2 |
10670842 |
2.46e-07 |
3.4e-09 |
CM009945.2 |
2 |
9534514 |
2.21e-07 |
3.4e-09 |
CM009946.2 |
2 |
7238532 |
2.28e-07 |
3.4e-09 |
CM009947.2 |
1 |
16343 |
0 |
3.4e-09 |
Mutation and recombination rates are in units of per bp and per generation.
Arabidopsis thaliana
- ID:
AraTha
- Name:
Arabidopsis thaliana
- Common name:
A. thaliana
- Generation time:
1.0 (Donohue, 2002)
- Ploidy:
2
- Population size:
10000 (1001GenomesConsortium, 2016)
Genome
- Genome assembly name:
TAIR10
ID |
Ploidy |
Length |
Recombination rate |
Mutation rate |
|---|---|---|---|---|
1 |
2 |
30427671 |
8.06452e-10 |
7e-09 |
2 |
2 |
19698289 |
8.06452e-10 |
7e-09 |
3 |
2 |
23459830 |
8.06452e-10 |
7e-09 |
4 |
2 |
18585056 |
8.06452e-10 |
7e-09 |
5 |
2 |
26975502 |
8.06452e-10 |
7e-09 |
Mt |
1 |
366924 |
0 |
7e-09 |
Pt |
1 |
154478 |
0 |
7e-09 |
Mutation and recombination rates are in units of per bp and per generation.
Genetic Maps
ID |
Year |
Description |
|---|---|---|
2012 |
Crossover frequency map averaged over 17 populations |
SalomeAveraged_TAIR10
This map is based on the study of crossover frequencies in over 7000 plants in 17 F2 populations derived from crosses between 18 A. thaliana accessions. Salomé et al provide genetic maps for each of these populations. To get a single map for each chromosome, the Haldane map function distances were converted to recombination rates (cM/Mb) for each cross and then averaged across the 17 populations using loess. The map was constructed on genome version TAIR7, and lifted to TAIR10.
Citations
Salomé et al., 2012. https://doi.org/10.1038/hdy.2011.95
Demographic Models
ID |
Description |
|---|---|
South Middle Atlas piecewise constant size |
|
South Middle Atlas African two epoch model |
|
South Middle Atlas African three epoch model |
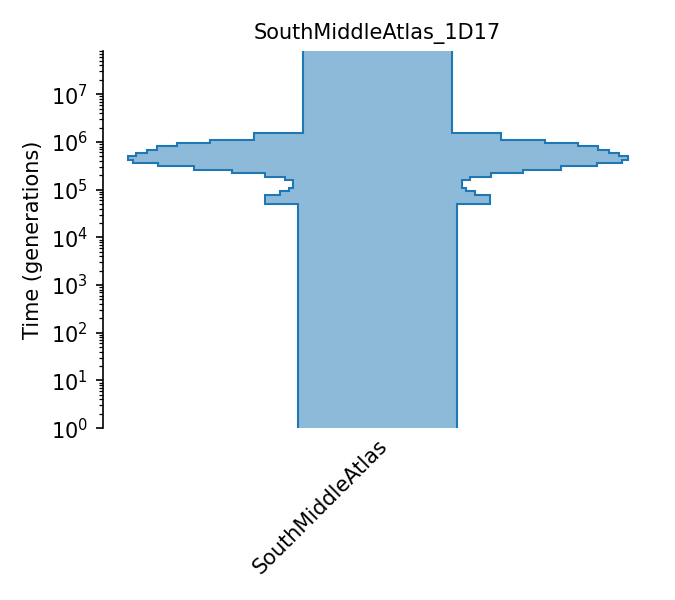
South Middle Atlas piecewise constant size
This model comes from MSMC using two randomly sampled homozygous individuals (Khe32 and Ifr4) from the South Middle Atlas region from the Middle Atlas Mountains in Morocco. The model is estimated with 32 time periods. Because estimates from the recent and ancient past are less accurate, we set the population size in the first 7 time periods equal to the size at the 8th time period and the size during last 2 time periods equal to the size in the 30th time period.
Details
- ID:
SouthMiddleAtlas_1D17
- Description:
South Middle Atlas piecewise constant size
- Num populations:
1
Populations
Index |
ID |
Sampling time |
Description |
|---|---|---|---|
0 |
SouthMiddleAtlas |
0 |
Arabidopsis Thaliana South Middle Atlas population |
Citations
Durvasula et al., 2017. https://doi.org/10.1073/pnas.1616736114
Demographic Model parameters
Parameter Type (units) |
Value |
Description |
|---|---|---|
Population size |
73,989 |
Ancestral population size |
Population size |
121,796 |
Pop. size during 1st time interval |
Population size |
165,210 |
Pop. size during 2nd time interval |
Population size |
198,019 |
Pop. size during 3rd time interval |
Population size |
217,752 |
Pop. size during 4th time interval |
Population size |
228,222 |
Pop. size during 5th time interval |
Population size |
238,593 |
Pop. size during 6th time interval |
Population size |
246,984 |
Pop. size during 7th time interval |
Population size |
241,400 |
Pop. size during 8th time interval |
Population size |
217,331 |
Pop. size during 9th time interval |
Population size |
181,571 |
Pop. size during 10th time interval |
Population size |
143456 |
Pop. size during 11th time interval |
Population size |
111,644 |
Pop. size during 12th time interval |
Population size |
91,813 |
Pop. size during 13th time interval |
Population size |
83,829 |
Pop. size during 14th time interval |
Population size |
83,932 |
Pop. size during 15th time interval |
Population size |
87,661 |
Pop. size during 16th time interval |
Population size |
96,283 |
Pop. size during 17th time interval |
Population size |
110,745 |
Pop. size during 18th time interval |
Population size |
111,132 |
Pop. size during 19th time interval |
Population size |
78,908 |
Pop. size during 20th time interval |
Time (yrs.) |
1,537,686 |
Begining of 1st time interval |
Time (yrs.) |
1,119,341 |
Begining of 2nd time interval |
Time (yrs.) |
954,517 |
Begining of 3rd time interval |
Time (yrs.) |
813,610 |
Begining of 4th time interval |
Time (yrs.) |
693,151 |
Begining of 5th time interval |
Time (yrs.) |
590,173 |
Begining of 6th time interval |
Time (yrs.) |
502,139 |
Begining of 7th time interval |
Time (yrs.) |
426,879 |
Begining of 8th time interval |
Time (yrs.) |
362,541 |
Begining of 9th time interval |
Time (yrs.) |
307,540 |
Begining of 10th time interval |
Time (yrs.) |
260,520 |
Begining of 11th time interval |
Time (yrs.) |
220,324 |
Begining of 12th time interval |
Time (yrs.) |
185,960 |
Begining of 13th time interval |
Time (yrs.) |
156,584 |
Begining of 14th time interval |
Time (yrs.) |
131,471 |
Begining of 15th time interval |
Time (yrs.) |
110,001 |
Begining of 16th time interval |
Time (yrs.) |
91,648 |
Begining of 17th time interval |
Time (yrs.) |
75,958 |
Begining of 18th time interval |
Time (yrs.) |
62,544 |
Begining of 19th time interval |
Time (yrs.) |
51,077 |
Begining of 20th time interval |
Generation time (yrs.) |
1 |
Average generation interval |
Mutation rate |
7.1e-9 |
Per-base per-generation mutation rate |
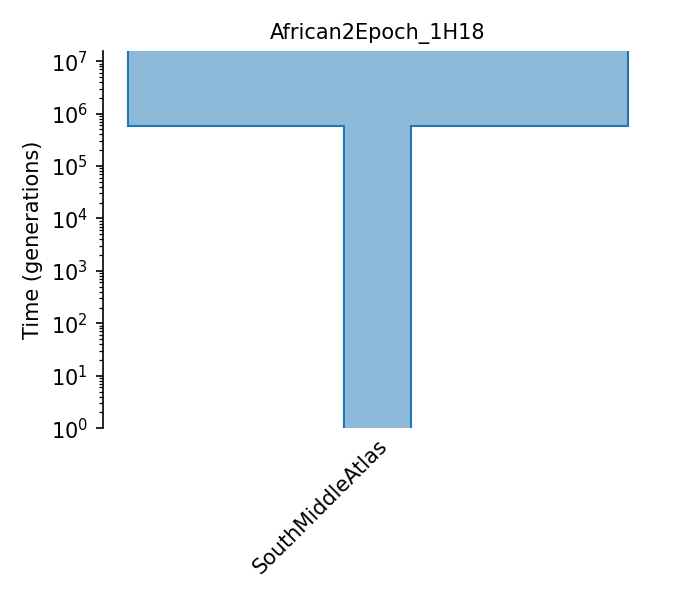
South Middle Atlas African two epoch model
Model estimated from site frequency spectrum of synonymous SNPs from African South Middle Atlas samples using Williamson et al. 2005 methodology. Values come from supplementary table 1 of Huber et al 2018. Sizes change from N_A -> N_0 and t_1 is time of the second epoch.
Details
- ID:
African2Epoch_1H18
- Description:
South Middle Atlas African two epoch model
- Num populations:
1
Populations
Index |
ID |
Sampling time |
Description |
|---|---|---|---|
0 |
SouthMiddleAtlas |
0 |
Arabidopsis Thaliana South Middle Atlas population |
Citations
Huber et al., 2018. https://doi.org/10.1038/s41467-018-05281-7
Demographic Model parameters
Parameter Type (units) |
Value |
Description |
|---|---|---|
Population size |
746,148 |
Ancestral pop. size |
Population size |
100,218 |
Pop. size during second epoch |
Epoch Time (gen.) |
568,344 |
Time of second epoch |
Generation time (yrs.) |
1 |
Average generation interval |
Mutation rate |
7e-9 |
Per-base per-generation mutation rate |
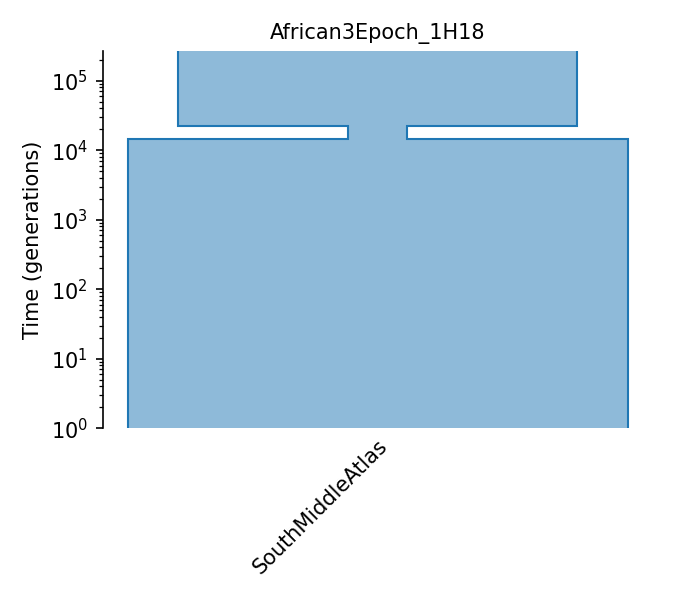
South Middle Atlas African three epoch model
Model estimated from site frequency spectrum of synonymous SNPs from African (South Middle Atlas) samples using Williamson et al. 2005 methodology. Values come from supplementary table 1 of Huber et al 2018. Sizes change from N_A -> N_2 -> N_3 and t_2 is the time of the second epoch and t_3 is the time of the 3rd epoch.
Details
- ID:
African3Epoch_1H18
- Description:
South Middle Atlas African three epoch model
- Num populations:
1
Populations
Index |
ID |
Sampling time |
Description |
|---|---|---|---|
0 |
SouthMiddleAtlas |
0 |
Arabidopsis Thaliana South Middle Atlas population |
Citations
Huber et al., 2018. https://doi.org/10.1038/s41467-018-05281-7
Demographic Model parameters
Parameter Type (units) |
Value |
Description |
|---|---|---|
Population size |
161,744 |
Ancestral pop. size |
Population size |
24,076 |
Pop. size during second epoch |
Population size |
203,077 |
Pop. size during Third epoch |
Epoch Time (gen.) |
7,420 |
Time of second epoch |
Epoch Time (gen.) |
14,534 |
Time of third epoch |
Generation time (yrs.) |
1 |
Average generation interval |
Mutation rate |
7e-9 |
Per-base per-generation mutation rate |
Annotations
ID |
Year |
Description |
|---|---|---|
2017 |
Araport11 exon annotations on TAIR10 |
|
2017 |
Araport11 exon annotations on TAIR10 |
araport_11_exons
Araport11 exon annotations on TAIR10
Citations
Cheng et al, 2017. http://dx.doi.org/10.1111/tpj.13415
araport_11_CDS
Araport11 exon annotations on TAIR10
Citations
Cheng et al, 2017. http://dx.doi.org/10.1111/tpj.13415
Distribution of Fitness Effects (DFEs)
ID |
Year |
Description |
|---|---|---|
2018 |
Deleterious additive Gamma DFE |
GammaAdditive_H18
Deleterious additive Gamma DFE
Additive, deleterious DFE from Huber et al. (2018) for Arabidopsis, estimated from the SFS of A. lyrata as a Gamma distribution of deleterious effects. Parameters are from Supplementary Table 4, the “genome-wide, additive-only model for A. lyrata”. The DFE for A. lyrata (rather than A. thaliana) is provided due to challenges with simulating selfing.
Citations
Huber et al., 2018. https://doi.org/10.1038/s41467-018-05281-7
DFE parameters
Proportion of mutations |
Distribution type |
Parameters |
Dominance |
|---|---|---|---|
100.0% |
Gamma |
mean = 0.000, shape = 0.270 |
h = 0.500 |
Bos taurus
- ID:
BosTau
- Name:
Bos taurus
- Common name:
Cattle
- Generation time:
- Ploidy:
2
- Population size:
62000 (MacLeod et al., 2013)
Genome
- Genome assembly name:
ARS-UCD1.3
ID |
Ploidy |
Length |
Recombination rate |
Mutation rate |
|---|---|---|---|---|
1 |
2 |
158534110 |
9.26e-09 |
1.2e-08 |
2 |
2 |
136231102 |
9.26e-09 |
1.2e-08 |
3 |
2 |
121005158 |
9.26e-09 |
1.2e-08 |
4 |
2 |
120000601 |
9.26e-09 |
1.2e-08 |
5 |
2 |
120089316 |
9.26e-09 |
1.2e-08 |
6 |
2 |
117806340 |
9.26e-09 |
1.2e-08 |
7 |
2 |
110682743 |
9.26e-09 |
1.2e-08 |
8 |
2 |
113319770 |
9.26e-09 |
1.2e-08 |
9 |
2 |
105454467 |
9.26e-09 |
1.2e-08 |
10 |
2 |
103308737 |
9.26e-09 |
1.2e-08 |
11 |
2 |
106982474 |
9.26e-09 |
1.2e-08 |
12 |
2 |
87216183 |
9.26e-09 |
1.2e-08 |
13 |
2 |
83472345 |
9.26e-09 |
1.2e-08 |
14 |
2 |
82403003 |
9.26e-09 |
1.2e-08 |
15 |
2 |
85007780 |
9.26e-09 |
1.2e-08 |
16 |
2 |
81013979 |
9.26e-09 |
1.2e-08 |
17 |
2 |
73167244 |
9.26e-09 |
1.2e-08 |
18 |
2 |
65820629 |
9.26e-09 |
1.2e-08 |
19 |
2 |
63449741 |
9.26e-09 |
1.2e-08 |
20 |
2 |
71974595 |
9.26e-09 |
1.2e-08 |
21 |
2 |
69862954 |
9.26e-09 |
1.2e-08 |
22 |
2 |
60773035 |
9.26e-09 |
1.2e-08 |
23 |
2 |
52498615 |
9.26e-09 |
1.2e-08 |
24 |
2 |
62317253 |
9.26e-09 |
1.2e-08 |
25 |
2 |
42350435 |
9.26e-09 |
1.2e-08 |
26 |
2 |
51992305 |
9.26e-09 |
1.2e-08 |
27 |
2 |
45612108 |
9.26e-09 |
1.2e-08 |
28 |
2 |
45940150 |
9.26e-09 |
1.2e-08 |
29 |
2 |
51098607 |
9.26e-09 |
1.2e-08 |
X |
2 |
139009144 |
9.26e-09 |
1.2e-08 |
MT |
1 |
16338 |
0 |
1.2e-08 |
Mutation and recombination rates are in units of per bp and per generation.
Demographic Models
ID |
Description |
|---|---|
Piecewise size model for Holstein-Friesian cattle (MacLeod et al., 2013). |
|
Piecewise size model for Holstein-Friesian cattle (Boitard et al., 2016). |
|
Piecewise size model for Fleckvieh cattle (Boitard et al., 2016). |
|
Piecewise size model for Jersey cattle (Boitard et al., 2016). |
|
Piecewise size model for Angus cattle (Boitard et al., 2016). |
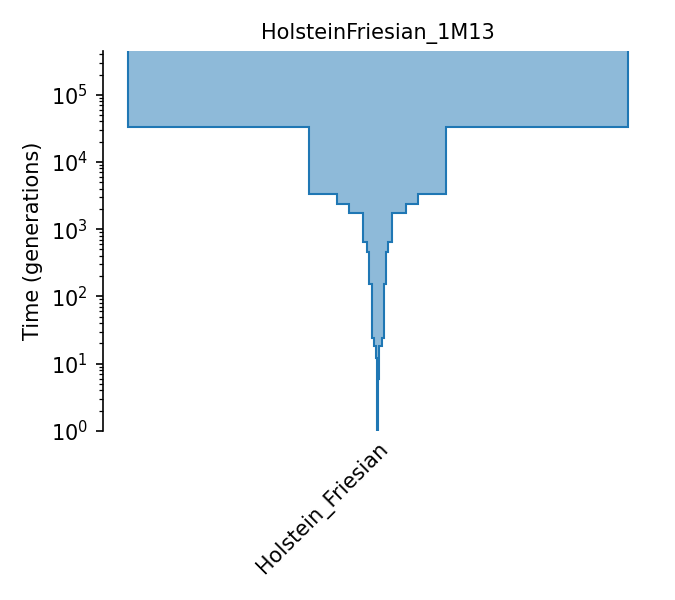
Piecewise size model for Holstein-Friesian cattle (MacLeod et al., 2013).
The piecewise-constant population size model of Holstein-Friesian cattle from MacLeod et al. (2013). Effective population sizes were estimated from runs of homozygosity observed in a single individual, using the following assumptions: a generation interval of 5 years (page 2213), a mutation rate of 0.94e-8 (pages 2221 and 2215), and a recombination rate of 1e-8 (pages 2215 and 2221). Effective population sizes are given in Figure 4A and Table S1. The single individual is the bull Walkway Chief Mark. Mark and his father are two of the most influentiual sires in this breed - see Larkin et al. (2012) http://www.pnas.org/cgi/doi/10.1073/pnas.1114546109.
Details
- ID:
HolsteinFriesian_1M13
- Description:
Piecewise size model for Holstein-Friesian cattle (MacLeod et al., 2013).
- Num populations:
1
Populations
Index |
ID |
Sampling time |
Description |
|---|---|---|---|
0 |
Holstein_Friesian |
0 |
Holstein-Friesian |
Citations
MacLeod et al., 2013. https://doi.org/10.1093/molbev/mst125
Demographic Model parameters
Parameter Type (units) |
Value |
Description |
|---|---|---|
Population size |
62,000 |
Ancestral population size |
Population size |
17,000 |
Pop. size during 1st time interval |
Population size |
10,000 |
Pop. size during 2nd time interval |
Population size |
7,000 |
Pop. size during 3rd time interval |
Population size |
3,500 |
Pop. size during 4th time interval |
Population size |
2,500 |
Pop. size during 5th time interval |
Population size |
2,000 |
Pop. size during 6th time interval |
Population size |
1,500 |
Pop. size during 7th time interval |
Population size |
1,000 |
Pop. size during 8th time interval |
Population size |
350 |
Pop. size during 9th time interval |
Population size |
250 |
Pop. size during 10th time interval |
Population size |
120 |
Pop. size during 11th time interval |
Population size |
90 |
Pop. size during 12th time interval |
Time (gen.) |
33,154 |
Begining of 1st time interval |
Time (gen.) |
3,354 |
Begining of 2nd time interval |
Time (gen.) |
2,354 |
Begining of 3rd time interval |
Time (gen.) |
1,754 |
Begining of 4th time interval |
Time (gen.) |
654 |
Begining of 5th time interval |
Time (gen.) |
454 |
Begining of 6th time interval |
Time (gen.) |
154 |
Begining of 7th time interval |
Time (gen.) |
24 |
Begining of 8th time interval |
Time (gen.) |
18 |
Begining of 9th time interval |
Time (gen.) |
12 |
Begining of 10th time interval |
Time (gen.) |
6 |
Begining of 11th time interval |
Time (gen.) |
3 |
Begining of 12th time interval |
Generation time (yrs.) |
5 |
Generation time |
Mutation rate |
9.4e-9 |
Per-base per-generation mutation rate |
Recombination rate |
1.0e-0 |
Per-base per-generation recombination rate |
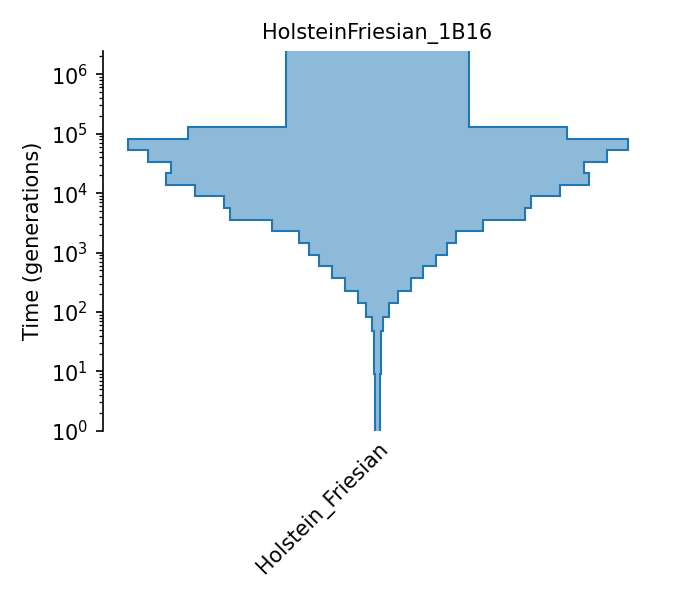
Piecewise size model for Holstein-Friesian cattle (Boitard et al., 2016).
The piecewise-constant population size model of Holstein-Friesian cattle from Boitard et al. (2016). Effective population sizes were estimated using Approximate Bayesian Computation with allele frequency spectrum and linkage-disequlibrium statistics (both on SNPs with minor allele frequency above 0.2) observed in 25 individuals, using the following assumptions: a generation interval of 5 years (page 10), a mutation rate of 1e-8 (pages 8 and 22), and a recombination rate of 3.66e-9 (page 15). Effective population sizes are given in Figure 6, with exact values provided by the lead author in personal communication. The 25 individuals’ genomes were obtained from the 1000 bull genomes Run 2 (of which 129 were Holstein-Friesian; the authors chose 52 from Australia to get a homogeneous sub-population, kept the least inbred and unrelated samples, and from these randomly selected 25).
Details
- ID:
HolsteinFriesian_1B16
- Description:
Piecewise size model for Holstein-Friesian cattle (Boitard et al., 2016).
- Num populations:
1
Populations
Index |
ID |
Sampling time |
Description |
|---|---|---|---|
0 |
Holstein_Friesian |
0 |
Holstein-Friesian |
Citations
Boitard et al., 2016. https://doi.org/10.1371/journal.pgen.1005877
Demographic Model parameters
Parameter Type (units) |
Value |
Description |
|---|---|---|
Population size |
31,652 |
Ancestral population size |
Population size |
65,485 |
Pop. size during 1st time interval |
Population size |
86,206 |
Pop. size during 2nd time interval |
Population size |
79,079 |
Pop. size during 3rd time interval |
Population size |
71,209 |
Pop. size during 4th time interval |
Population size |
72,841 |
Pop. size during 5th time interval |
Population size |
63,092 |
Pop. size during 6th time interval |
Population size |
52,882 |
Pop. size during 7th time interval |
Population size |
50,726 |
Pop. size during 8th time interval |
Population size |
36,512 |
Pop. size during 9th time interval |
Population size |
27,155 |
Pop. size during 10th time interval |
Population size |
23,783 |
Pop. size during 11th time interval |
Population size |
20,159 |
Pop. size during 12th time interval |
Population size |
15,602 |
Pop. size during 13th time interval |
Population size |
11,367 |
Pop. size during 14th time interval |
Population size |
6,908 |
Pop. size during 15th time interval |
Population size |
3,892 |
Pop. size during 16th time interval |
Population size |
1,815 |
Pop. size during 17th time interval |
Population size |
1,320 |
Pop. size during 18th time interval |
Population size |
1,076 |
Pop. size during 19th time interval |
Population size |
793 |
Pop. size during 20th time interval |
Time (gen.) |
129,999 |
Begining of 1st time interval |
Time (gen.) |
83,043 |
Begining of 2nd time interval |
Time (gen.) |
53,045 |
Begining of 3rd time interval |
Time (gen.) |
33,881 |
Begining of 4th time interval |
Time (gen.) |
21,638 |
Begining of 5th time interval |
Time (gen.) |
13,817 |
Begining of 6th time interval |
Time (gen.) |
8,821 |
Begining of 7th time interval |
Time (gen.) |
5,629 |
Begining of 8th time interval |
Time (gen.) |
3,590 |
Begining of 9th time interval |
Time (gen.) |
2,287 |
Begining of 10th time interval |
Time (gen.) |
1,455 |
Begining of 11th time interval |
Time (gen.) |
923 |
Begining of 12th time interval |
Time (gen.) |
584 |
Begining of 13th time interval |
Time (gen.) |
367 |
Begining of 14th time interval |
Time (gen.) |
228 |
Begining of 15th time interval |
Time (gen.) |
139 |
Begining of 16th time interval |
Time (gen.) |
83 |
Begining of 17th time interval |
Time (gen.) |
47 |
Begining of 18th time interval |
Time (gen.) |
24 |
Begining of 19th time interval |
Time (gen.) |
9 |
Begining of 20th time interval |
Generation time (yrs.) |
5 |
Generation time |
Mutation rate |
1e-8 |
Per-base per-generation mutation rate |
Recombination rate |
3.66e-9 |
Per-base per-generation recombination rate |
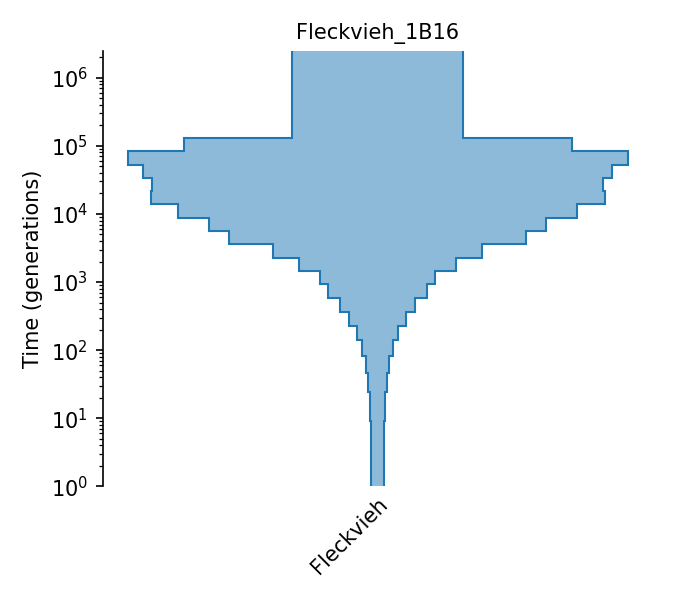
Piecewise size model for Fleckvieh cattle (Boitard et al., 2016).
The piecewise-constant population size model of Fleckvieh cattle from Boitard et al. (2016). Effective population sizes were estimated using Approximate Bayesian Computation with allele frequency spectrum and linkage-disequlibrium statistics (both on SNPs with minor allele frequency above 0.2) observed in 25 individuals, using the following assumptions: a generation interval of 5 years (page 10), a mutation rate of 1e-8 (pages 8 and 22), and a recombination rate of 3.89e-9 (page 15). Effective population sizes are given in Figure 6, with exact values provided by the lead author in personal communication. The 25 individuals’ genomes were obtained from the 1000 bull genomes Run 2 (of which 43 were Fleckvieh; the authors kept the least inbred and unrelated samples, and from these randomly selected 25).
Details
- ID:
Fleckvieh_1B16
- Description:
Piecewise size model for Fleckvieh cattle (Boitard et al., 2016).
- Num populations:
1
Populations
Index |
ID |
Sampling time |
Description |
|---|---|---|---|
0 |
Fleckvieh |
0 |
Fleckvieh |
Citations
Boitard et al., 2016. https://doi.org/10.1371/journal.pgen.1005877
Demographic Model parameters
Parameter Type (units) |
Value |
Description |
|---|---|---|
Population size |
31,131 |
Ancestral population size |
Population size |
70,789 |
Pop. size during 1st time interval |
Population size |
91,228 |
Pop. size during 2nd time interval |
Population size |
85,607 |
Pop. size during 3rd time interval |
Population size |
82,448 |
Pop. size during 4th time interval |
Population size |
82,844 |
Pop. size during 5th time interval |
Population size |
72,920 |
Pop. size during 6th time interval |
Population size |
61,479 |
Pop. size during 7th time interval |
Population size |
54,358 |
Pop. size during 8th time interval |
Population size |
38,069 |
Pop. size during 9th time interval |
Population size |
28,547 |
Pop. size during 10th time interval |
Population size |
20,963 |
Pop. size during 11th time interval |
Population size |
18,176 |
Pop. size during 12th time interval |
Population size |
13,604 |
Pop. size during 13th time interval |
Population size |
10,546 |
Pop. size during 14th time interval |
Population size |
7,414 |
Pop. size during 15th time interval |
Population size |
5,689 |
Pop. size during 16th time interval |
Population size |
4,184 |
Pop. size during 17th time interval |
Population size |
3,395 |
Pop. size during 18th time interval |
Population size |
2,812 |
Pop. size during 19th time interval |
Population size |
2,227 |
Pop. size during 20th time interval |
Time (gen.) |
129,999 |
Begining of 1st time interval |
Time (gen.) |
83,043 |
Begining of 2nd time interval |
Time (gen.) |
53,045 |
Begining of 3rd time interval |
Time (gen.) |
33,881 |
Begining of 4th time interval |
Time (gen.) |
21,638 |
Begining of 5th time interval |
Time (gen.) |
13,817 |
Begining of 6th time interval |
Time (gen.) |
8,821 |
Begining of 7th time interval |
Time (gen.) |
5,629 |
Begining of 8th time interval |
Time (gen.) |
3,590 |
Begining of 9th time interval |
Time (gen.) |
2,287 |
Begining of 10th time interval |
Time (gen.) |
1,455 |
Begining of 11th time interval |
Time (gen.) |
923 |
Begining of 12th time interval |
Time (gen.) |
584 |
Begining of 13th time interval |
Time (gen.) |
367 |
Begining of 14th time interval |
Time (gen.) |
228 |
Begining of 15th time interval |
Time (gen.) |
139 |
Begining of 16th time interval |
Time (gen.) |
83 |
Begining of 17th time interval |
Time (gen.) |
47 |
Begining of 18th time interval |
Time (gen.) |
24 |
Begining of 19th time interval |
Time (gen.) |
9 |
Begining of 20th time interval |
Generation time (yrs.) |
5 |
Generation time |
Mutation rate |
1e-8 |
Per-base per-generation mutation rate |
Recombination rate |
3.89e-9 |
Per-base per-generation recombination rate |
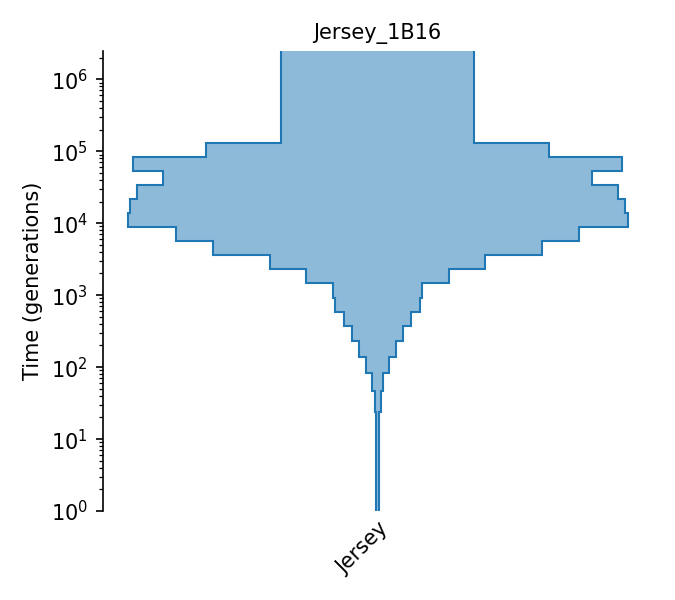
Piecewise size model for Jersey cattle (Boitard et al., 2016).
The piecewise-constant population size model of Jersey cattle from Boitard et al. (2016). Effective population sizes were estimated using Approximate Bayesian Computation with allele frequency spectrum and linkage-disequlibrium statistics (both on SNPs with minor allele frequency above 0.2) observed in 15 individuals, using the following assumptions: a generation interval of 5 years (page 10), a mutation rate of 1e-8 (pages 8 and 22), and a recombination rate of 4.58e-9 (page 15). Effective population sizes are given in Figure 6, with exact values provided by the lead author in personal communication. The 15 individuals’ genomes were obtained from the 1000 bull genomes Run 2.
Details
- ID:
Jersey_1B16
- Description:
Piecewise size model for Jersey cattle (Boitard et al., 2016).
- Num populations:
1
Populations
Index |
ID |
Sampling time |
Description |
|---|---|---|---|
0 |
Jersey |
0 |
Jersey |
Citations
Boitard et al., 2016. https://doi.org/10.1371/journal.pgen.1005877
Demographic Model parameters
Parameter Type (units) |
Value |
Description |
|---|---|---|
Population size |
30,275 |
Ancestral population size |
Population size |
53,856 |
Pop. size during 1st time interval |
Population size |
76,905 |
Pop. size during 2nd time interval |
Population size |
67,505 |
Pop. size during 3rd time interval |
Population size |
75,739 |
Pop. size during 4th time interval |
Population size |
77,971 |
Pop. size during 5th time interval |
Population size |
78,608 |
Pop. size during 6th time interval |
Population size |
63,277 |
Pop. size during 7th time interval |
Population size |
51,777 |
Pop. size during 8th time interval |
Population size |
33,713 |
Pop. size during 9th time interval |
Population size |
22,549 |
Pop. size during 10th time interval |
Population size |
13,960 |
Pop. size during 11th time interval |
Population size |
13,460 |
Pop. size during 12th time interval |
Population size |
10,474 |
Pop. size during 13th time interval |
Population size |
8,106 |
Pop. size during 14th time interval |
Population size |
5,766 |
Pop. size during 15th time interval |
Population size |
3,704 |
Pop. size during 16th time interval |
Population size |
1,640 |
Pop. size during 17th time interval |
Population size |
947 |
Pop. size during 18th time interval |
Population size |
561 |
Pop. size during 19th time interval |
Population size |
388 |
Pop. size during 20th time interval |
Time (gen.) |
129,999 |
Begining of 1st time interval |
Time (gen.) |
83,043 |
Begining of 2nd time interval |
Time (gen.) |
53,045 |
Begining of 3rd time interval |
Time (gen.) |
33,881 |
Begining of 4th time interval |
Time (gen.) |
21,638 |
Begining of 5th time interval |
Time (gen.) |
13,817 |
Begining of 6th time interval |
Time (gen.) |
8,821 |
Begining of 7th time interval |
Time (gen.) |
5,629 |
Begining of 8th time interval |
Time (gen.) |
3,590 |
Begining of 9th time interval |
Time (gen.) |
2,287 |
Begining of 10th time interval |
Time (gen.) |
1,455 |
Begining of 11th time interval |
Time (gen.) |
923 |
Begining of 12th time interval |
Time (gen.) |
584 |
Begining of 13th time interval |
Time (gen.) |
367 |
Begining of 14th time interval |
Time (gen.) |
228 |
Begining of 15th time interval |
Time (gen.) |
139 |
Begining of 16th time interval |
Time (gen.) |
83 |
Begining of 17th time interval |
Time (gen.) |
47 |
Begining of 18th time interval |
Time (gen.) |
24 |
Begining of 19th time interval |
Time (gen.) |
9 |
Begining of 20th time interval |
Generation time (yrs.) |
5 |
Generation time |
Mutation rate |
1e-8 |
Per-base per-generation mutation rate |
Recombination rate |
4.58e-9 |
Per-base per-generation recombination rate |
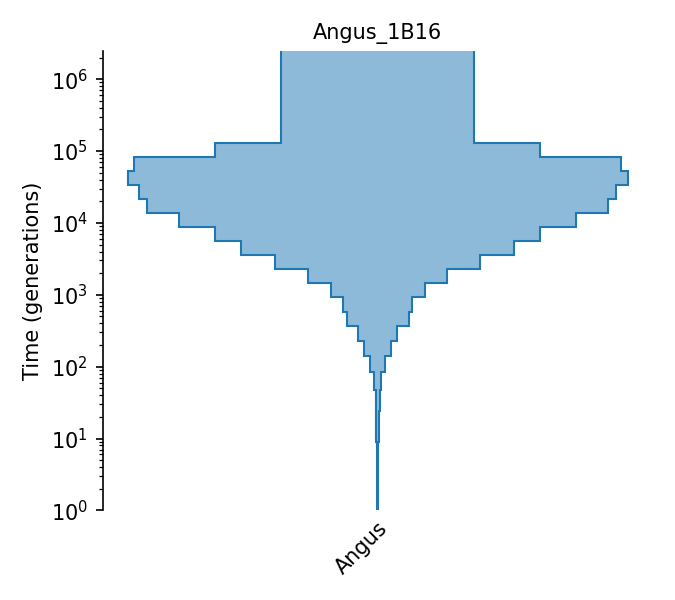
Piecewise size model for Angus cattle (Boitard et al., 2016).
The piecewise-constant population size model of Angus cattle from Boitard et al. (2016). Effective population sizes were estimated using Approximate Bayesian Computation with allele frequency spectrum and linkage-disequlibrium statistics (both on SNPs with minor allele frequency above 0.2) observed in 15 individuals, using the following assumptions: a generation interval of 5 years (page 10), a mutation rate of 1e-8 (pages 8 and 22), and a recombination rate of 5.00e-9 (page 15). Effective population sizes are given in Figure 6, with exact values provided by the lead author in personal communication. The 25 individuals’ genomes were obtained from the 1000 bull genomes Run 2 (of which 47 were Angus; the authors kept the least inbred and unrelated samples, and from these randomly selected 25).
Details
- ID:
Angus_1B16
- Description:
Piecewise size model for Angus cattle (Boitard et al., 2016).
- Num populations:
1
Populations
Index |
ID |
Sampling time |
Description |
|---|---|---|---|
0 |
Angus |
0 |
Angus |
Citations
Boitard et al., 2016. https://doi.org/10.1371/journal.pgen.1005877
Demographic Model parameters
Parameter Type (units) |
Value |
Description |
|---|---|---|
Population size |
33,810 |
Ancestral population size |
Population size |
56,981 |
Pop. size during 1st time interval |
Population size |
85,228 |
Pop. size during 2nd time interval |
Population size |
87,426 |
Pop. size during 3rd time interval |
Population size |
83,576 |
Pop. size during 4th time interval |
Population size |
80,651 |
Pop. size during 5th time interval |
Population size |
69,328 |
Pop. size during 6th time interval |
Population size |
56,775 |
Pop. size during 7th time interval |
Population size |
47,892 |
Pop. size during 8th time interval |
Population size |
35,998 |
Pop. size during 9th time interval |
Population size |
24,300 |
Pop. size during 10th time interval |
Population size |
16,441 |
Pop. size during 11th time interval |
Population size |
12,042 |
Pop. size during 12th time interval |
Population size |
10,827 |
Pop. size during 13th time interval |
Population size |
6,837 |
Pop. size during 14th time interval |
Population size |
4,836 |
Pop. size during 15th time interval |
Population size |
2,558 |
Pop. size during 16th time interval |
Population size |
1,224 |
Pop. size during 17th time interval |
Population size |
709 |
Pop. size during 18th time interval |
Population size |
412 |
Pop. size during 19th time interval |
Population size |
291 |
Pop. size during 20th time interval |
Time (gen.) |
129,999 |
Begining of 1st time interval |
Time (gen.) |
83,043 |
Begining of 2nd time interval |
Time (gen.) |
53,045 |
Begining of 3rd time interval |
Time (gen.) |
33,881 |
Begining of 4th time interval |
Time (gen.) |
21,638 |
Begining of 5th time interval |
Time (gen.) |
13,817 |
Begining of 6th time interval |
Time (gen.) |
8,821 |
Begining of 7th time interval |
Time (gen.) |
5,629 |
Begining of 8th time interval |
Time (gen.) |
3,590 |
Begining of 9th time interval |
Time (gen.) |
2,287 |
Begining of 10th time interval |
Time (gen.) |
1,455 |
Begining of 11th time interval |
Time (gen.) |
923 |
Begining of 12th time interval |
Time (gen.) |
584 |
Begining of 13th time interval |
Time (gen.) |
367 |
Begining of 14th time interval |
Time (gen.) |
228 |
Begining of 15th time interval |
Time (gen.) |
139 |
Begining of 16th time interval |
Time (gen.) |
83 |
Begining of 17th time interval |
Time (gen.) |
47 |
Begining of 18th time interval |
Time (gen.) |
24 |
Begining of 19th time interval |
Time (gen.) |
9 |
Begining of 20th time interval |
Generation time (yrs.) |
5 |
Generation time |
Mutation rate |
1e-8 |
Per-base per-generation mutation rate |
Recombination rate |
5.00e-9 |
Per-base per-generation recombination rate |
Caenorhabditis elegans
- ID:
CaeEle
- Name:
Caenorhabditis elegans
- Common name:
C. elegans
- Generation time:
0.01 (Frézal & Félix, 2015)
- Ploidy:
2
- Population size:
10000 (Barrière & Félix, 2005; Cutter, 2006)
Genome
- Genome assembly name:
WBcel235
ID |
Ploidy |
Length |
Recombination rate |
Mutation rate |
|---|---|---|---|---|
I |
2 |
15072434 |
3.12163e-11 |
1.84e-09 |
II |
2 |
15279421 |
3.52929e-11 |
1.84e-09 |
III |
2 |
13783801 |
3.9066e-11 |
1.84e-09 |
IV |
2 |
17493829 |
2.7121e-11 |
1.84e-09 |
V |
2 |
20924180 |
2.47057e-11 |
1.84e-09 |
X |
2 |
17718942 |
2.94724e-11 |
1.84e-09 |
MtDNA |
1 |
13794 |
0 |
1.05e-07 |
Mutation and recombination rates are in units of per bp and per generation.
Genetic Maps
ID |
Year |
Description |
|---|---|---|
2009 |
Genetic map from recombinant inbred advanced intercross lines |
RockmanRIAIL_ce11
The authors genotyped 1454 nuclear SNP markers in 236 recombinant inbred advanced intercross lines (RIAILs). The genetic distances were estimated in r/qtl using the Haldane map function, treating observed recombination fractions as though they had been observed in a backcross. The marker density is sufficiently high that the exact form of map function employed has little effect on estimated genetic distances. The tip domains of each chromosome were defined by including all markers between the chromosome ends and the first recombination breakpoint observed in the RIAILs. The genetic map corresponds to the assembly ce11 (GCA_000002985.3).
Citations
Rockman & Kruglyak, 2009. https://doi.org/10.1371/journal.pgen.1000419
Canis familiaris
- ID:
CanFam
- Name:
Canis familiaris
- Common name:
Dog
- Generation time:
3
- Ploidy:
2
- Population size:
13000 (Lindblad-Toh et al., 2005)
Genome
- Genome assembly name:
CanFam3.1
ID |
Ploidy |
Length |
Recombination rate |
Mutation rate |
|---|---|---|---|---|
1 |
2 |
122678785 |
7.636e-09 |
4e-09 |
2 |
2 |
85426708 |
8.79852e-09 |
4e-09 |
3 |
2 |
91889043 |
8.00087e-09 |
4e-09 |
4 |
2 |
88276631 |
8.0523e-09 |
4e-09 |
5 |
2 |
88915250 |
9.34433e-09 |
4e-09 |
6 |
2 |
77573801 |
8.19219e-09 |
4e-09 |
7 |
2 |
80974532 |
7.29347e-09 |
4e-09 |
8 |
2 |
74330416 |
8.29131e-09 |
4e-09 |
9 |
2 |
61074082 |
9.28772e-09 |
4e-09 |
10 |
2 |
69331447 |
9.10715e-09 |
4e-09 |
11 |
2 |
74389097 |
7.63945e-09 |
4e-09 |
12 |
2 |
72498081 |
7.76106e-09 |
4e-09 |
13 |
2 |
63241923 |
8.41302e-09 |
4e-09 |
14 |
2 |
60966679 |
9.02812e-09 |
4e-09 |
15 |
2 |
64190966 |
7.85675e-09 |
4e-09 |
16 |
2 |
59632846 |
8.61406e-09 |
4e-09 |
17 |
2 |
64289059 |
9.71883e-09 |
4e-09 |
18 |
2 |
55844845 |
1.02993e-08 |
4e-09 |
19 |
2 |
53741614 |
1.04251e-08 |
4e-09 |
20 |
2 |
58134056 |
9.99097e-09 |
4e-09 |
21 |
2 |
50858623 |
1.0339e-08 |
4e-09 |
22 |
2 |
61439934 |
8.61505e-09 |
4e-09 |
23 |
2 |
52294480 |
9.12664e-09 |
4e-09 |
24 |
2 |
47698779 |
1.1146e-08 |
4e-09 |
25 |
2 |
51628933 |
1.15437e-08 |
4e-09 |
26 |
2 |
38964690 |
1.20846e-08 |
4e-09 |
27 |
2 |
45876710 |
1.12603e-08 |
4e-09 |
28 |
2 |
41182112 |
1.24636e-08 |
4e-09 |
29 |
2 |
41845238 |
1.10136e-08 |
4e-09 |
30 |
2 |
40214260 |
1.16876e-08 |
4e-09 |
31 |
2 |
39895921 |
1.13977e-08 |
4e-09 |
32 |
2 |
38810281 |
1.15559e-08 |
4e-09 |
33 |
2 |
31377067 |
1.33394e-08 |
4e-09 |
34 |
2 |
42124431 |
1.04838e-08 |
4e-09 |
35 |
2 |
26524999 |
1.42991e-08 |
4e-09 |
36 |
2 |
30810995 |
1.18752e-08 |
4e-09 |
37 |
2 |
30902991 |
1.38346e-08 |
4e-09 |
38 |
2 |
23914537 |
1.43637e-08 |
4e-09 |
X |
2 |
123869142 |
9.50648e-09 |
4e-09 |
MT |
1 |
16727 |
0 |
4e-09 |
Mutation and recombination rates are in units of per bp and per generation.
Genetic Maps
ID |
Year |
Description |
|---|---|---|
2016 |
Pedigree-based crossover map from 237 individuals |
Campbell2016_CanFam3_1
Sex-averaged crossover frequency map based on 163,400 autosomal SNPs genotyped in a pedigree of 237 Labrador Retriever x Greyhound crosses. Genotypes were phased without respect to the pedigree, using SHAPEIT2, recombinations were called using duoHMM, and genetic distances were obtained using Haldane’s map function.
Citations
Campbell et al., 2016. https://doi.org/10.1534/g3.116.034678
Demographic Models
ID |
Description |
|---|---|
Dog domestication and admixture with wolf (Freedman et al., 2014) |
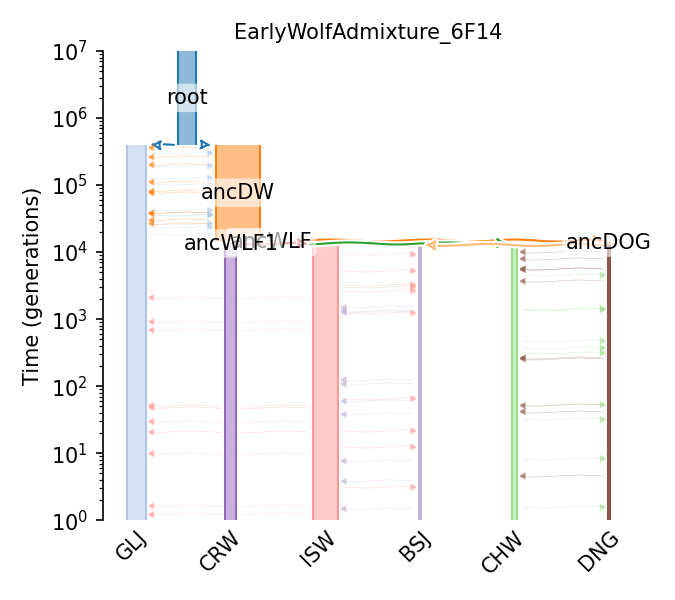
Dog domestication and admixture with wolf (Freedman et al., 2014)
Demographic model of dog domestication with the Boxer reference genome, two basal dog breeds, three wolves, and a golden jackal (outgroup) from Freedman et al. (2014). The topology was based on the neighbor-joining tree constructed from genome-wide pairwise divergence (Figure 5A). The parameters of the model were inferred using the Generalized Phylogenetic Coalescent Sampler (G-PhoCS) on neutral autosomal loci from whole genome sequences. Model parameters were calibrated with a generation interval of 3 years (page 3) and a mutation rate of 1e-8 (page 3). Estimated (calibrated) effective population sizes, divergence times, and migration rates are given in Table S12. Migration is constant continuous geneflow from the start and end times of the two populations that define it (section S9.2.3 in S9). While Boxer reference genome was used, no Boxer-specific parameters were estimated in the model, hence Boxer was removed from this model implementation. Thence the ancestral Basenji population with its specific Ne is for the Ancestral (Boxer, Basenji) population.
Details
- ID:
EarlyWolfAdmixture_6F14
- Description:
Dog domestication and admixture with wolf (Freedman et al., 2014)
- Num populations:
11
Populations
Index |
ID |
Sampling time |
Description |
|---|---|---|---|
0 |
BSJ |
None |
Basenji |
1 |
DNG |
None |
Dingo |
2 |
CHW |
None |
Chinese wolf |
3 |
ISW |
None |
Israeli wolf |
4 |
CRW |
None |
Croatian wolf |
5 |
GLJ |
None |
Golden jackal |
6 |
ancDOG |
12795 |
Ancestral ((Boxer, Basenji), Dingo) |
7 |
ancWLF1 |
13389 |
Ancestral (Israeli, Croatian) wolf |
8 |
ancWLF |
13455 |
Ancestral ((Israeli, Croatian), Chinese) wolf |
9 |
ancDW |
14874 |
Ancestral (dog, wolf) |
10 |
root |
398262 |
Ancestral ((dog, wolf), golden jackal) root |
Citations
Freedman et al., 2014. https://doi.org/10.1371/journal.pgen.1004016
Demographic Model parameters
Parameter Type (units) |
Value |
Description |
|---|---|---|
Population size |
2,639 |
Basenji pop. size |
Population size |
1,914 |
Dingo pop. size |
Population size |
26,092 |
Israeli wolf pop. size |
Population size |
11,427 |
Croatian wolf pop. size |
Population size |
5,426 |
Chinese wolf pop. size |
Population size |
19,446 |
Golden jackal pop. size |
Population size |
793 |
Ancestral (Boxer, Basenji) pop. size |
Population size |
1,999 |
Ancestral ((Boxer, Basenji), Dingo) pop. size |
Population size |
1,393 |
Ancestral (Israeli, Croatian) wolf pop. size |
Population size |
12,627 |
Ancestral ((Israeli, Croatian), Chinese) wolf pop. size |
Population size |
44,993 |
Ancestral (dog, wolf) pop. size |
Population size |
18,169 |
Ancestral ((dog, wolf), golden jackal)root pop. size |
Migration rate |
0.18 |
Israeli wolf -> Basenji migration rate |
Migration rate |
0.07 |
Basenji -> Israeli wolf migration rate |
Migration rate |
0.03 |
Chinese wolf -> Dingo migration rate |
Migration rate |
0.04 |
Dingo -> Chinese wolf migration rate |
Migration rate |
0.00 |
Golden jackal -> Israeli wolf migration rate |
Migration rate |
0.05 |
Israeli wolf -> Golden jackal migration rate |
Migration rate |
0.02 |
Golden jackal -> Ancestral (dog, wolf) migration rate |
Migration rate |
0.99 |
Ancestral (dog, wolf) -> Golden jackal migration rate |
Time (gen.) |
12,795 |
Ancestral ((Boxer, Basenji), Dingo) split time |
Time (gen.) |
13,389 |
Ancestral (Israeli, Croatian) wolf split time |
Time (gen.) |
13,455 |
Ancestral ((Israeli, Croatian), Chinese) wolf split time |
Time (gen.) |
14,874 |
Ancestral (dog, wolf) split time |
Time (gen.) |
398,262 |
Ancestral ((dog, wolf), golden jackal) split time |
Generation time (yrs.) |
3 |
Generation time |
Mutation rate |
1e-8 |
Mutation rate |
Chlamydomonas reinhardtii
- ID:
ChlRei
- Name:
Chlamydomonas reinhardtii
- Common name:
Chlamydomonas reinhardtii
- Generation time:
0.001141552511415525 (Vítová et al, 2011)
- Ploidy:
1
- Population size:
1.3999999999999998e-07 (Ness et al., 2016)
Genome
- Genome assembly name:
Chlamydomonas_reinhardtii_v5.5
ID |
Ploidy |
Length |
Recombination rate |
Mutation rate |
|---|---|---|---|---|
1 |
1 |
8033585 |
1.21e-10 |
9.74e-10 |
2 |
1 |
9223677 |
1.49e-10 |
8.62e-10 |
3 |
1 |
9219486 |
1.52e-10 |
9.5e-10 |
4 |
1 |
4091191 |
1.47e-10 |
9.66e-10 |
5 |
1 |
3500558 |
1.7e-10 |
1.17e-09 |
6 |
1 |
9023763 |
1.17e-10 |
9.12e-10 |
7 |
1 |
6421821 |
8.66e-11 |
9.14e-10 |
8 |
1 |
5033832 |
1.39e-10 |
8.98e-10 |
9 |
1 |
7956127 |
1.12e-10 |
9.17e-10 |
10 |
1 |
6576019 |
1.97e-10 |
9.27e-10 |
11 |
1 |
3826814 |
1.63e-10 |
1.03e-09 |
12 |
1 |
9730733 |
9.15e-11 |
9.55e-10 |
13 |
1 |
5206065 |
1.43e-10 |
7.56e-10 |
14 |
1 |
4157777 |
1.9e-10 |
8.96e-10 |
15 |
1 |
1922860 |
3.93e-10 |
6.91e-10 |
16 |
1 |
7783580 |
1.71e-10 |
9.59e-10 |
17 |
1 |
7188315 |
1.83e-10 |
1.05e-09 |
Mutation and recombination rates are in units of per bp and per generation.
Drosophila melanogaster
- ID:
DroMel
- Name:
Drosophila melanogaster
- Common name:
D. melanogaster
- Generation time:
0.1 (Li et al., 2006)
- Ploidy:
2
- Population size:
1720600 (Li et al., 2006)
Genome
- Genome assembly name:
BDGP6.46
- Mean gene conversion fraction:
0.8299999999999998
- Range gene conversion lengths:
518
ID |
Ploidy |
Length |
Recombination rate |
Mutation rate |
|---|---|---|---|---|
2L |
2 |
23513712 |
2.40463e-08 |
5.49e-09 |
2R |
2 |
25286936 |
2.23459e-08 |
5.49e-09 |
3L |
2 |
28110227 |
1.7966e-08 |
5.49e-09 |
3R |
2 |
32079331 |
1.71642e-08 |
5.49e-09 |
4 |
2 |
1348131 |
0 |
5.49e-09 |
X |
2 |
23542271 |
2.89651e-08 |
5.49e-09 |
Y |
1 |
3667352 |
0 |
5.49e-09 |
mitochondrion_genome |
1 |
19524 |
0 |
5.49e-09 |
Mutation and recombination rates are in units of per bp and per generation.
Genetic Maps
ID |
Year |
Description |
|---|---|---|
2012 |
Crossover map from meioses products of 8 lab crosses |
|
2012 |
Crossover map from meioses products of 8 lab crosses |
ComeronCrossover_dm6
The crossover map from a study of 8 crosses of 12 highly inbred lines of D. melanogaster. This is based on the products of 5,860 female meioses from whole genome sequencing data. Recombination rates were calculated from the density of individual recombination events that were detected in crosses. This map was subsequently lifted over to the dm6 assembly.
Citations
Comeron et al, 2012. https://doi.org/10.1371/journal.pgen.1002905
ComeronCrossoverV2_dm6
The crossover map from a study of 8 crosses of 12 highly inbred lines of D. melanogaster. This is based on the products of 5,860 female meioses from whole genome sequencing data. Recombination rates were calculated from the density of individual recombination events that were detected in crosses. This map was subsequently lifted over to the dm6 assembly using the available maintenance code command: python liftOver_comeron2012.py –winLen 1000 –gapThresh 1000000 –useAdjacentAvg –retainIntermediates
Citations
Comeron et al, 2012. https://doi.org/10.1371/journal.pgen.1002905
Demographic Models
ID |
Description |
|---|---|
Three epoch African population |
|
Three epoch model for African and European populations |
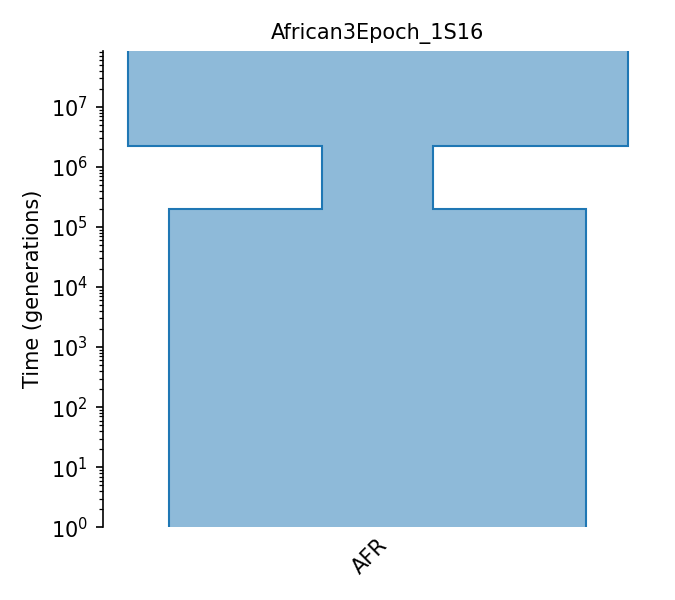
Three epoch African population
The three epoch (modern, bottleneck, ancestral) model estimated for a single African Drosophila Melanogaster population from Sheehan and Song (2016). Population sizes are estimated by a deep learning model trained on simulation data. NOTE: Due to differences in coalescence units between PSMC (2N) and msms (4N) the number of generations were doubled from PSMC estimates when simulating data from msms in the original publication. We have faithfully represented the published model here.
Details
- ID:
African3Epoch_1S16
- Description:
Three epoch African population
- Num populations:
1
Populations
Index |
ID |
Sampling time |
Description |
|---|---|---|---|
0 |
AFR |
0 |
African D. melanogaster population |
Citations
Sheehan and Song, 2016. https://doi.org/10.1371/journal.pcbi.1004845
Demographic Model parameters
Parameter Type (units) |
Value |
Description |
|---|---|---|
Population size |
100,000 |
Reference population size |
Population size |
652,700 |
Ancestral pop. Size |
Population size |
145,300 |
Bottleneck pop. size |
Population size |
544,200 |
Recent pop. size |
Epoch Time (gen.) |
2,200,000 |
Onset of bottleneck |
Epoch Time (gen.) |
200,000 |
Population expansion |
Generation time (yrs.) |
0.1 |
Generation time |
Mutation rate |
8.4e-9 |
Per-base per-generation mutation rate |
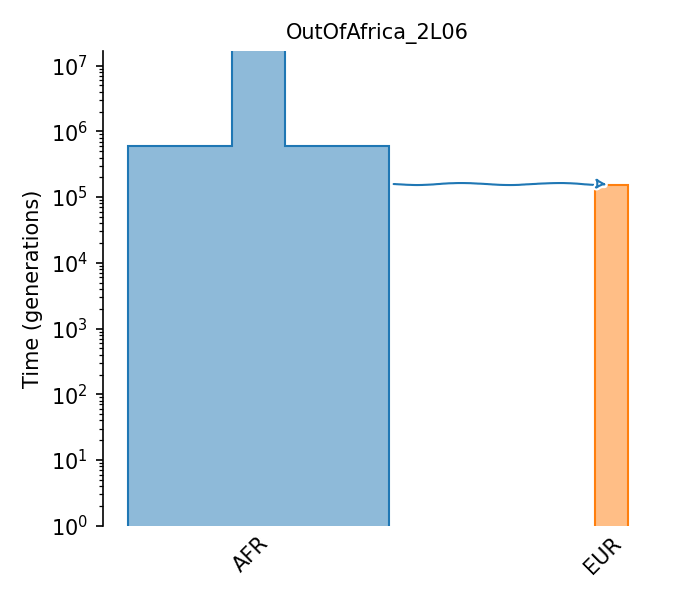
Three epoch model for African and European populations
The three epoch (modern, bottleneck, ancestral) model estimated for two Drosophila Melanogaster populations: African (ancestral) and European (derived) from Li and Stephan (2006).
Details
- ID:
OutOfAfrica_2L06
- Description:
Three epoch model for African and European populations
- Num populations:
2
Populations
Index |
ID |
Sampling time |
Description |
|---|---|---|---|
0 |
AFR |
0 |
African D. melanogaster population |
1 |
EUR |
0 |
European D. melanogaster population |
Citations
Li et al., 2006. https://doi.org/10.1371/journal.pgen.0020166
Demographic Model parameters
Parameter Type (units) |
Value |
Description |
|---|---|---|
Population size |
1,720,600 |
Ancestral pop. Size |
Population size |
8,603,000 |
Post-expansion African pop. Size |
Population size |
2,200 |
European bottleneck pop. size |
Population size |
1,075,000 |
Modern European pop. size |
Epoch Time (gen.) |
600,000 |
Expansion of population in Africa |
Epoch Time (gen.) |
158,000 |
African-European divergence |
Epoch Time (gen.) |
154,600 |
European pop. Expansion |
Generation time (yrs.) |
0.1 |
Generation time |
Mutation rate |
1.45e-9 |
Per-base per-generation mutation rate |
Annotations
ID |
Year |
Description |
|---|---|---|
2014 |
FlyBase exon annotations on BDGP6 |
|
2014 |
FlyBase CDS annotations on BDGP6 |
FlyBase_BDGP6.32.51_exons
FlyBase exon annotations on BDGP6
Citations
Hoskins et al, 2014. https://doi.org/10.1101/gr.185579.114
FlyBase_BDGP6.32.51_CDS
FlyBase CDS annotations on BDGP6
Citations
Hoskins et al, 2014. https://doi.org/10.1101/gr.185579.114
Distribution of Fitness Effects (DFEs)
ID |
Year |
Description |
|---|---|---|
2017 |
Deleterious Gamma DFE |
|
2021 |
Deleterious Gamma DFE with fixed-s beneficials |
|
2016 |
Deleterious log-normal and beneficial mixed DFE |
Gamma_H17
Deleterious Gamma DFE
Deleterious, gamma-distributed DFE estimated from a D. melanogaster SFS in Huber et al. (2017). DFE parameters are based on the “full” model described in Table S2, for which singletons were excluded and a recent mutation rate estimate is used (3e-9, Keightley 2014).
Citations
Huber et al., 2017. https://doi.org/10.1073/pnas.1619508114
DFE parameters
Proportion of mutations |
Distribution type |
Parameters |
Dominance |
|---|---|---|---|
26.0% |
Fixed s |
s = 0.000 |
h = 0.500 |
74.0% |
Gamma |
mean = -0.001, shape = 0.330 |
h = 0.500 |
GammaPos_H17
Deleterious Gamma DFE with fixed-s beneficials
The DFE estimated from D.melanogaster-simulans data estimated in Zhen et al (2021, https://dx.doi.org/10.1101/gr.256636.119). This uses the demographic model and deleterious-only DFE from Huber et al (2017), and then the number of nonsynonymous differences to simulans to estimate a proportion of nonsynonmyous differences and (single) selection coefficient. So, this is the “Gamma_H17” DFE, with some proportion of positive selection with fixed s.
Citations
Zhen et al., 2021. https://dx.doi.org/10.1101/gr.256636.119
DFE parameters
Proportion of mutations |
Distribution type |
Parameters |
Dominance |
|---|---|---|---|
26.0% |
Fixed s |
s = 0.000 |
h = 0.500 |
74.0% |
Gamma |
mean = -0.000, shape = 0.330 |
h = 0.500 |
0.0% |
Fixed s |
s = 0.000 |
h = 0.500 |
LognormalPlusPositive_R16
Deleterious log-normal and beneficial mixed DFE
Estimated DFE containing deleterious and beneficial mutations, estimated by Ragsdale et al. (2016), with a log-normal distribution for deleterious mutations and a single selection coefficient for positive mutations. The DFE was inferred in scaled units from the triallelic frequency spectrum in D. melanogaster, here scaled to real units using an effective population size of Ne=2.8e6 (Huber et al 2017).
Citations
Ragsdale et al., 2016. https://doi.org/10.1534/genetics.115.184812
DFE parameters
Proportion of mutations |
Distribution type |
Parameters |
Dominance |
|---|---|---|---|
28.6% |
Fixed s |
s = 0.000 |
h = 0.500 |
70.9% |
Negative LogNormal |
meanlog = -9.425, sdlog = 3.360 |
h = 0.500 |
0.6% |
Fixed s |
s = 0.000 |
h = 0.500 |
Drosophila sechellia
- ID:
DroSec
- Name:
Drosophila sechellia
- Common name:
Drosophila sechellia
- Generation time:
0.05 (Legrand et al., 2009)
- Ploidy:
2
- Population size:
100000 (Legrand et al., 2009)
Genome
- Genome assembly name:
ASM438219v1
ID |
Ploidy |
Length |
Recombination rate |
Mutation rate |
|---|---|---|---|---|
2L |
2 |
24956976 |
2.28e-08 |
1.5e-09 |
2R |
2 |
21536224 |
2.51e-08 |
1.5e-09 |
3L |
2 |
28131630 |
1.88e-08 |
1.5e-09 |
3R |
2 |
30464902 |
1.91e-08 |
1.5e-09 |
X |
2 |
22909512 |
2.85e-08 |
1.5e-09 |
4 |
2 |
1277805 |
0 |
1.5e-09 |
Mutation and recombination rates are in units of per bp and per generation.
Escherichia coli
- ID:
EscCol
- Name:
Escherichia coli
- Common name:
E. coli
- Generation time:
3.805175e-05 (Sezonov et al., 2007)
- Ploidy:
1
- Population size:
180000000.0 (Hartl, Moriyama, and Sawyer, 1994)
Genome
- Genome assembly name:
ASM584v2
- Bacterial recombination with tract length range:
542
ID |
Ploidy |
Length |
Recombination rate |
Mutation rate |
|---|---|---|---|---|
Chromosome |
1 |
4641652 |
8.9e-11 |
8.9e-11 |
Mutation and recombination rates are in units of per bp and per generation.
Gasterosteus aculeatus
- ID:
GasAcu
- Name:
Gasterosteus aculeatus
- Common name:
Three-spined stickleback
- Generation time:
2 (Liu et al., 2016)
- Ploidy:
2
- Population size:
10000.0 (Liu et al., 2016)
Genome
- Genome assembly name:
GAculeatus_UGA_version5
ID |
Ploidy |
Length |
Recombination rate |
Mutation rate |
|---|---|---|---|---|
1 |
2 |
29619991 |
3.11e-08 |
3.7e-08 |
2 |
2 |
23686546 |
3.11e-08 |
3.7e-08 |
3 |
2 |
17759012 |
3.11e-08 |
3.7e-08 |
4 |
2 |
34181212 |
3.11e-08 |
3.7e-08 |
5 |
2 |
15550311 |
3.11e-08 |
3.7e-08 |
6 |
2 |
18825451 |
3.11e-08 |
3.7e-08 |
7 |
2 |
30776923 |
3.11e-08 |
3.7e-08 |
8 |
2 |
20553084 |
3.11e-08 |
3.7e-08 |
9 |
2 |
20843631 |
3.11e-08 |
3.7e-08 |
10 |
2 |
17985176 |
3.11e-08 |
3.7e-08 |
11 |
2 |
17651971 |
3.11e-08 |
3.7e-08 |
12 |
2 |
20694444 |
3.11e-08 |
3.7e-08 |
13 |
2 |
20748428 |
3.11e-08 |
3.7e-08 |
14 |
2 |
16147532 |
3.11e-08 |
3.7e-08 |
15 |
2 |
17318724 |
3.11e-08 |
3.7e-08 |
16 |
2 |
19507025 |
3.11e-08 |
3.7e-08 |
17 |
2 |
20195758 |
3.11e-08 |
3.7e-08 |
18 |
2 |
15939336 |
3.11e-08 |
3.7e-08 |
19 |
2 |
20580295 |
3.11e-08 |
3.7e-08 |
20 |
2 |
20445003 |
3.11e-08 |
3.7e-08 |
21 |
2 |
17421465 |
3.11e-08 |
3.7e-08 |
Y |
1 |
15859692 |
0 |
3.7e-08 |
MT |
1 |
16543 |
0 |
3.7e-08 |
Mutation and recombination rates are in units of per bp and per generation.
Gorilla gorilla
- ID:
GorGor
- Name:
Gorilla gorilla
- Common name:
Gorilla
- Generation time:
19.0 (Besenbacher et al., 2019)
- Ploidy:
2
- Population size:
25200 (Yu et al., 2004)
Genome
- Genome assembly name:
gorGor4
ID |
Ploidy |
Length |
Recombination rate |
Mutation rate |
|---|---|---|---|---|
1 |
2 |
228908639 |
1.193e-08 |
1.235e-08 |
2A |
2 |
107640188 |
1.193e-08 |
1.235e-08 |
2B |
2 |
135448346 |
1.193e-08 |
1.235e-08 |
3 |
2 |
201391403 |
1.193e-08 |
1.235e-08 |
4 |
2 |
203093366 |
1.193e-08 |
1.235e-08 |
5 |
2 |
165317712 |
1.193e-08 |
1.235e-08 |
6 |
2 |
173266796 |
1.193e-08 |
1.235e-08 |
7 |
2 |
159110946 |
1.193e-08 |
1.235e-08 |
8 |
2 |
146757320 |
1.193e-08 |
1.235e-08 |
9 |
2 |
121655618 |
1.193e-08 |
1.235e-08 |
10 |
2 |
148642438 |
1.193e-08 |
1.235e-08 |
11 |
2 |
135235416 |
1.193e-08 |
1.235e-08 |
12 |
2 |
133456746 |
1.193e-08 |
1.235e-08 |
13 |
2 |
97154659 |
1.193e-08 |
1.235e-08 |
14 |
2 |
90977943 |
1.193e-08 |
1.235e-08 |
15 |
2 |
80890724 |
1.193e-08 |
1.235e-08 |
16 |
2 |
81384781 |
1.193e-08 |
1.235e-08 |
17 |
2 |
95888799 |
1.193e-08 |
1.235e-08 |
18 |
2 |
78004504 |
1.193e-08 |
1.235e-08 |
19 |
2 |
57935654 |
1.193e-08 |
1.235e-08 |
20 |
2 |
63231202 |
1.193e-08 |
1.235e-08 |
21 |
2 |
37891338 |
1.193e-08 |
1.235e-08 |
22 |
2 |
34650175 |
1.193e-08 |
1.235e-08 |
X |
2 |
156331669 |
1.193e-08 |
1.235e-08 |
MT |
1 |
16412 |
0 |
1.235e-08 |
Mutation and recombination rates are in units of per bp and per generation.
Demographic Models
ID |
Description |
|---|---|
Ghost admixture in eastern gorillas |
Ghost admixture in eastern gorillas
Demographic model of ghost admixture into eastern gorillas from Pawar et al. (2023) Fig. 2A and Supp. Table 1. This model simulates five populations: mountain gorillas, eastern lowland gorillas, western lowland gorillas, cross river gorillas, and a extinct ghost lineage. The ghost admixture event is modelled as a 2.47% pulse from the ghost lineage to a population ancestral to eastern gorillas. Migration events among eastern and western lowland gorillas are modelled as single generation pulses. Population size changes are also modelled.
Details
- ID:
GorillaGhost_5P23
- Description:
Ghost admixture in eastern gorillas
- Num populations:
5
Populations
Index |
ID |
Sampling time |
Description |
|---|---|---|---|
0 |
cross_river |
0 |
Contemporary Cross River Gorillas |
1 |
western_lowland |
0 |
Contemporary Western Lowland Gorillas |
2 |
eastern_lowland |
0 |
Contemporary Eastern Lowland Gorillas |
3 |
mountain |
0 |
Contemporary Mountain Gorillas |
4 |
ghost |
None |
Extinct ghost lineage |
Citations
Pawar et al. 2023, 2023. https://doi.org/10.1038/s41559-023-02145-2
Demographic Model parameters
Parameter Type (units) |
Value |
Description |
|---|---|---|
Population size |
14,558 |
Conteporary cross-river pop. size |
Population size |
64,749 |
Contemporary western lowland pop. size |
Population size |
20,894 |
Contemporary eastern lowland pop. size |
Population size |
2,158 |
Contemporary mountain pop. size |
Population size |
25,000 |
Ghost pop. size |
Population size |
243 |
Eastern lowland bottleneck pop. size |
Population size |
21,982 |
Eastern lowland ancestral pop. size |
Population size |
115 |
Mountain bottleneck pop. size |
Population size |
3,009 |
Mountain ancestral pop. size |
Population size |
5,325 |
Eastern lowland-Mountain ancestral pop. size |
Population size |
48,288 |
Western lowland ancestral pop. size |
Population size |
98,135 |
Western/Cross-river ancestral pop. size |
Population size |
14,364 |
Extant subspecies ancestral pop. size |
Population size |
35,381 |
Ghost-extant ancestral pop. size |
Migration rate (fraction per generation) |
0.02477 |
Ghost->(Eastern/Mountain) migration rate |
Migration rate (fraction per generation) |
0.002768 |
(Eastern/Mountain)->Western migration rate |
Migration rate (fraction per generation) |
0.00827 |
Western->(Eastern/Mountain) migration rate |
Epoch time (years ago) |
30 |
End of Eastern lowland bottleneck |
Epoch time (years ago) |
7,220 |
Start of Eastern lowland bottleneck |
Epoch time (years ago) |
9,120 |
End of Mountain bottleneck |
Epoch time (years ago) |
9,310 |
Start of Mountain bottleneck |
Epoch time (years ago) |
15,048 |
Eastern lowland-Mountain split |
Epoch time (years ago) |
34,000 |
End of Western lowland-(Eastern/Mountain ancestor) admixture |
Epoch time (years ago) |
34,002 |
Start of Western lowland-(Eastern/Mountain ancestor) admixture |
Epoch time (years ago) |
38,281 |
End of Ghost admixture |
Epoch time (years ago) |
38,300 |
Start of Ghost admixture |
Epoch time (years ago) |
40,896 |
Western lowland pop size change |
Epoch time (years ago) |
454,313 |
Western/Cross-river split |
Epoch time (years ago) |
965,481 |
Extant gorilla subspecies split |
Epoch time (years ago) |
3,421,360 |
Ghost-extant subspecies split |
Generation time (years ago) |
19 |
Generation time |
Mutation rate |
1.235e-8 |
Per-base per-generation mutation rate |

Helianthus annuus
- ID:
HelAnn
- Name:
Helianthus annuus
- Common name:
Helianthus annuus
- Generation time:
- Ploidy:
2
- Population size:
673968 (Strasburg et al., 2010)
Genome
- Genome assembly name:
HanXRQr2.0-SUNRISE
ID |
Ploidy |
Length |
Recombination rate |
Mutation rate |
|---|---|---|---|---|
1 |
2 |
149502186 |
4e-09 |
6.1e-09 |
2 |
2 |
174800439 |
4e-09 |
6.1e-09 |
3 |
2 |
176490873 |
4e-09 |
6.1e-09 |
4 |
2 |
208320189 |
4e-09 |
6.1e-09 |
5 |
2 |
178169690 |
4e-09 |
6.1e-09 |
6 |
2 |
148147350 |
4e-09 |
6.1e-09 |
7 |
2 |
149542083 |
4e-09 |
6.1e-09 |
8 |
2 |
167167940 |
4e-09 |
6.1e-09 |
9 |
2 |
189665024 |
4e-09 |
6.1e-09 |
10 |
2 |
181411567 |
4e-09 |
6.1e-09 |
11 |
2 |
189830405 |
4e-09 |
6.1e-09 |
12 |
2 |
163781230 |
4e-09 |
6.1e-09 |
13 |
2 |
173487274 |
4e-09 |
6.1e-09 |
14 |
2 |
173346949 |
4e-09 |
6.1e-09 |
15 |
2 |
175671323 |
4e-09 |
6.1e-09 |
16 |
2 |
206736614 |
4e-09 |
6.1e-09 |
17 |
2 |
195042445 |
4e-09 |
6.1e-09 |
Mutation and recombination rates are in units of per bp and per generation.
Heliconius melpomene
- ID:
HelMel
- Name:
Heliconius melpomene
- Common name:
Heliconius melpomene
- Generation time:
0.0958904109589041 (Pardo-Diaz et al, 2012)
- Ploidy:
2
- Population size:
2111109 (Pardo-Diaz et al, 2012)
Genome
- Genome assembly name:
Hmel2.5
ID |
Ploidy |
Length |
Recombination rate |
Mutation rate |
|---|---|---|---|---|
1 |
2 |
17206585 |
3.17e-08 |
2.9e-09 |
2 |
2 |
9045316 |
5.61e-08 |
2.9e-09 |
3 |
2 |
10541528 |
5.1e-08 |
2.9e-09 |
4 |
2 |
9662098 |
4.97e-08 |
2.9e-09 |
5 |
2 |
9908586 |
5.15e-08 |
2.9e-09 |
6 |
2 |
14054175 |
3.4e-08 |
2.9e-09 |
7 |
2 |
14308859 |
3.76e-08 |
2.9e-09 |
8 |
2 |
9320449 |
5.28e-08 |
2.9e-09 |
9 |
2 |
8708747 |
5.31e-08 |
2.9e-09 |
10 |
2 |
17965481 |
3.16e-08 |
2.9e-09 |
11 |
2 |
11759272 |
4.47e-08 |
2.9e-09 |
12 |
2 |
16327298 |
3.13e-08 |
2.9e-09 |
13 |
2 |
18127314 |
3.08e-08 |
2.9e-09 |
14 |
2 |
9174305 |
5.47e-08 |
2.9e-09 |
15 |
2 |
10235750 |
4.78e-08 |
2.9e-09 |
16 |
2 |
10083215 |
4.71e-08 |
2.9e-09 |
17 |
2 |
14773299 |
3.94e-08 |
2.9e-09 |
18 |
2 |
16803890 |
3.16e-08 |
2.9e-09 |
19 |
2 |
16399344 |
3.11e-08 |
2.9e-09 |
20 |
2 |
14871695 |
3.45e-08 |
2.9e-09 |
21 |
2 |
13359691 |
3.71e-08 |
2.9e-09 |
Mutation and recombination rates are in units of per bp and per generation.
Homo sapiens
- ID:
HomSap
- Name:
Homo sapiens
- Common name:
Human
- Generation time:
- Ploidy:
2
- Population size:
10000 (Takahata, 1993)
Genome
- Genome assembly name:
GRCh38.p14
ID |
Ploidy |
Length |
Recombination rate |
Mutation rate |
|---|---|---|---|---|
1 |
2 |
248956422 |
1.15235e-08 |
1.29e-08 |
2 |
2 |
242193529 |
1.10429e-08 |
1.29e-08 |
3 |
2 |
198295559 |
1.12585e-08 |
1.29e-08 |
4 |
2 |
190214555 |
1.1482e-08 |
1.29e-08 |
5 |
2 |
181538259 |
1.12443e-08 |
1.29e-08 |
6 |
2 |
170805979 |
1.12659e-08 |
1.29e-08 |
7 |
2 |
159345973 |
1.17713e-08 |
1.29e-08 |
8 |
2 |
145138636 |
1.16049e-08 |
1.29e-08 |
9 |
2 |
138394717 |
1.21987e-08 |
1.29e-08 |
10 |
2 |
133797422 |
1.33337e-08 |
1.29e-08 |
11 |
2 |
135086622 |
1.17213e-08 |
1.29e-08 |
12 |
2 |
133275309 |
1.30981e-08 |
1.29e-08 |
13 |
2 |
114364328 |
1.3061e-08 |
1.29e-08 |
14 |
2 |
107043718 |
1.36298e-08 |
1.29e-08 |
15 |
2 |
101991189 |
1.73876e-08 |
1.29e-08 |
16 |
2 |
90338345 |
1.48315e-08 |
1.29e-08 |
17 |
2 |
83257441 |
1.55383e-08 |
1.29e-08 |
18 |
2 |
80373285 |
1.46455e-08 |
1.29e-08 |
19 |
2 |
58617616 |
1.83848e-08 |
1.29e-08 |
20 |
2 |
64444167 |
1.67886e-08 |
1.29e-08 |
21 |
2 |
46709983 |
1.72443e-08 |
1.29e-08 |
22 |
2 |
50818468 |
2.10572e-08 |
1.29e-08 |
X |
2 |
156040895 |
1.18483e-08 |
1.29e-08 |
Y |
1 |
57227415 |
0 |
1.29e-08 |
MT |
1 |
16569 |
0 |
1.29e-08 |
Mutation and recombination rates are in units of per bp and per generation.
Genetic Maps
ID |
Year |
Description |
|---|---|---|
2007 |
HapMap Phase II lifted over to GRCh37 |
|
2007 |
HapMap Phase II lifted over to GRCh37 then lifted over to GRCh38 |
|
2010 |
Sex averaged map from deCode family study |
|
2010 |
Sex averaged map from deCode family study |
|
2019 |
Pyrho population-specific map for ACB |
|
2019 |
Pyrho population-specific map for ASW |
|
2019 |
Pyrho population-specific map for BEB |
|
2019 |
Pyrho population-specific map for CDX |
|
2019 |
Pyrho population-specific map for CEU |
|
2019 |
Pyrho population-specific map for CHB |
|
2019 |
Pyrho population-specific map for CHS |
|
2019 |
Pyrho population-specific map for CLM |
|
2019 |
Pyrho population-specific map for ESN |
|
2019 |
Pyrho population-specific map for FIN |
|
2019 |
Pyrho population-specific map for GBR |
|
2019 |
Pyrho population-specific map for GIH |
|
2019 |
Pyrho population-specific map for GWD |
|
2019 |
Pyrho population-specific map for IBS |
|
2019 |
Pyrho population-specific map for ITU |
|
2019 |
Pyrho population-specific map for JPT |
|
2019 |
Pyrho population-specific map for KHV |
|
2019 |
Pyrho population-specific map for LWK |
|
2019 |
Pyrho population-specific map for MSL |
|
2019 |
Pyrho population-specific map for MXL |
|
2019 |
Pyrho population-specific map for PEL |
|
2019 |
Pyrho population-specific map for PJL |
|
2019 |
Pyrho population-specific map for PUR |
|
2019 |
Pyrho population-specific map for STU |
|
2019 |
Pyrho population-specific map for TSI |
|
2019 |
Pyrho population-specific map for YRI |
HapMapII_GRCh37
This genetic map is from the Phase II Hapmap project and based on 3.1 million genotyped SNPs from 270 individuals across four populations (YRI, CEU, CHB and JPT). Genome wide recombination rates were estimated using LDHat. This version of the HapMap genetic map was lifted over to GRCh37 (and adjusted in regions where the genome assembly had rearranged) for use in the 1000 Genomes project. Please see the README file on the 1000 Genomes download site for details of these adjustments. ftp://ftp-trace.ncbi.nih.gov/1000genomes/ftp/technical/working/20110106_recombination_hotspots
Citations
The International HapMap Consortium, 2007. https://doi.org/10.1038/nature06258
HapMapII_GRCh38
This genetic map is from the Phase II Hapmap project and based on 3.1 million genotyped SNPs from 270 individuals across four populations (YRI, CEU, CHB and JPT). Genome wide recombination rates were estimated using LDHat. This version is lifted over to GRCh38 using liftover from the HapMap Phase II map previously lifted over to GRCh37. Liftover was performed using the liftOver_catalog.py script from stdpopsim/maintainance. Exact command used is as follows: `python <path_to_stdpopsim>/stdpopsim/maintenance/liftOver_catalog.py –species HomSap –map HapMapII_GRCh37 –chainFile <path_to_chainfiles>/chainfiles/hg19ToHg38.over.chain.gz –validationChain <path_to_chainfiles>/chainfiles/hg38ToHg19.over.chain.gz –winLen 1000 –useAdjacentAvg –retainIntermediates –gapThresh 1000000`
Citations
The International HapMap Consortium, 2007. https://doi.org/10.1038/nature06258
DeCodeSexAveraged_GRCh36
This genetic map is from the deCode study of recombination events in 15,257 parent-offspring pairs from Iceland. 289,658 phased autosomal SNPs were used to call recombinations within these families, and recombination rates computed from the density of these events. This is the combined male and female (sex averaged) map. See https://www.decode.com/addendum/ for more details.
Citations
Kong et al, 2010. https://doi.org/10.1038/nature09525
DeCodeSexAveraged_GRCh38
This genetic map is from the deCode study of recombination events in 15,257 parent-offspring pairs from Iceland. 289,658 phased autosomal SNPs were used to call recombinations within these families, and recombination rates computed from the density of these events. This is the combined male and female (sex averaged) map. See https://www.decode.com/addendum/ for more details. This map is further lifted over from the original GRCh36 to GRCh38 using liftover. Liftover was performed using the liftOver_catalog.py script from stdpopsim/maintainance. Exact command used is as follows: `python <path_to_stdpopsim>/stdpopsim/maintenance/liftOver_catalog.py –species HomSap –map DeCodeSexAveraged_GRCh36 –chainFile <path_to_chainfiles>/chainfiles/hg18ToHg38.over.chain.gz –winLen 1000 –useAdjacentAvg –retainIntermediates –gapThresh 1000000` Validation chain file does not exist for liftover between these two assemblies hence validation was performed manually separately.
Citations
Kong et al, 2010. https://doi.org/10.1038/nature09525
PyrhoACB_GRCh38
This genetic map was inferred using individuals from the ACB population from Phase 3 of the 1000 Genomes Project. Rates were estimated using pyrho (https://github.com/popgenmethods/pyrho) while using population-specific population size history estimates obtained from smc++ (https://github.com/popgenmethods/smcpp). Genetic maps are only available for the 22 autosomes. See https://doi.org/10.1126/sciadv.aaw9206 for more details.
Citations
Spence and Song, 2019. https://doi.org/10.1126/sciadv.aaw9206
PyrhoASW_GRCh38
This genetic map was inferred using individuals from the ASW population from Phase 3 of the 1000 Genomes Project. Rates were estimated using pyrho (https://github.com/popgenmethods/pyrho) while using population-specific population size history estimates obtained from smc++ (https://github.com/popgenmethods/smcpp). Genetic maps are only available for the 22 autosomes. See https://doi.org/10.1126/sciadv.aaw9206 for more details.
Citations
Spence and Song, 2019. https://doi.org/10.1126/sciadv.aaw9206
PyrhoBEB_GRCh38
This genetic map was inferred using individuals from the BEB population from Phase 3 of the 1000 Genomes Project. Rates were estimated using pyrho (https://github.com/popgenmethods/pyrho) while using population-specific population size history estimates obtained from smc++ (https://github.com/popgenmethods/smcpp). Genetic maps are only available for the 22 autosomes. See https://doi.org/10.1126/sciadv.aaw9206 for more details.
Citations
Spence and Song, 2019. https://doi.org/10.1126/sciadv.aaw9206
PyrhoCDX_GRCh38
This genetic map was inferred using individuals from the CDX population from Phase 3 of the 1000 Genomes Project. Rates were estimated using pyrho (https://github.com/popgenmethods/pyrho) while using population-specific population size history estimates obtained from smc++ (https://github.com/popgenmethods/smcpp). Genetic maps are only available for the 22 autosomes. See https://doi.org/10.1126/sciadv.aaw9206 for more details.
Citations
Spence and Song, 2019. https://doi.org/10.1126/sciadv.aaw9206
PyrhoCEU_GRCh38
This genetic map was inferred using individuals from the CEU population from Phase 3 of the 1000 Genomes Project. Rates were estimated using pyrho (https://github.com/popgenmethods/pyrho) while using population-specific population size history estimates obtained from smc++ (https://github.com/popgenmethods/smcpp). Genetic maps are only available for the 22 autosomes. See https://doi.org/10.1126/sciadv.aaw9206 for more details.
Citations
Spence and Song, 2019. https://doi.org/10.1126/sciadv.aaw9206
PyrhoCHB_GRCh38
This genetic map was inferred using individuals from the CHB population from Phase 3 of the 1000 Genomes Project. Rates were estimated using pyrho (https://github.com/popgenmethods/pyrho) while using population-specific population size history estimates obtained from smc++ (https://github.com/popgenmethods/smcpp). Genetic maps are only available for the 22 autosomes. See https://doi.org/10.1126/sciadv.aaw9206 for more details.
Citations
Spence and Song, 2019. https://doi.org/10.1126/sciadv.aaw9206
PyrhoCHS_GRCh38
This genetic map was inferred using individuals from the CHS population from Phase 3 of the 1000 Genomes Project. Rates were estimated using pyrho (https://github.com/popgenmethods/pyrho) while using population-specific population size history estimates obtained from smc++ (https://github.com/popgenmethods/smcpp). Genetic maps are only available for the 22 autosomes. See https://doi.org/10.1126/sciadv.aaw9206 for more details.
Citations
Spence and Song, 2019. https://doi.org/10.1126/sciadv.aaw9206
PyrhoCLM_GRCh38
This genetic map was inferred using individuals from the CLM population from Phase 3 of the 1000 Genomes Project. Rates were estimated using pyrho (https://github.com/popgenmethods/pyrho) while using population-specific population size history estimates obtained from smc++ (https://github.com/popgenmethods/smcpp). Genetic maps are only available for the 22 autosomes. See https://doi.org/10.1126/sciadv.aaw9206 for more details.
Citations
Spence and Song, 2019. https://doi.org/10.1126/sciadv.aaw9206
PyrhoESN_GRCh38
This genetic map was inferred using individuals from the ESN population from Phase 3 of the 1000 Genomes Project. Rates were estimated using pyrho (https://github.com/popgenmethods/pyrho) while using population-specific population size history estimates obtained from smc++ (https://github.com/popgenmethods/smcpp). Genetic maps are only available for the 22 autosomes. See https://doi.org/10.1126/sciadv.aaw9206 for more details.
Citations
Spence and Song, 2019. https://doi.org/10.1126/sciadv.aaw9206
PyrhoFIN_GRCh38
This genetic map was inferred using individuals from the FIN population from Phase 3 of the 1000 Genomes Project. Rates were estimated using pyrho (https://github.com/popgenmethods/pyrho) while using population-specific population size history estimates obtained from smc++ (https://github.com/popgenmethods/smcpp). Genetic maps are only available for the 22 autosomes. See https://doi.org/10.1126/sciadv.aaw9206 for more details.
Citations
Spence and Song, 2019. https://doi.org/10.1126/sciadv.aaw9206
PyrhoGBR_GRCh38
This genetic map was inferred using individuals from the GBR population from Phase 3 of the 1000 Genomes Project. Rates were estimated using pyrho (https://github.com/popgenmethods/pyrho) while using population-specific population size history estimates obtained from smc++ (https://github.com/popgenmethods/smcpp). Genetic maps are only available for the 22 autosomes. See https://doi.org/10.1126/sciadv.aaw9206 for more details.
Citations
Spence and Song, 2019. https://doi.org/10.1126/sciadv.aaw9206
PyrhoGIH_GRCh38
This genetic map was inferred using individuals from the GIH population from Phase 3 of the 1000 Genomes Project. Rates were estimated using pyrho (https://github.com/popgenmethods/pyrho) while using population-specific population size history estimates obtained from smc++ (https://github.com/popgenmethods/smcpp). Genetic maps are only available for the 22 autosomes. See https://doi.org/10.1126/sciadv.aaw9206 for more details.
Citations
Spence and Song, 2019. https://doi.org/10.1126/sciadv.aaw9206
PyrhoGWD_GRCh38
This genetic map was inferred using individuals from the GWD population from Phase 3 of the 1000 Genomes Project. Rates were estimated using pyrho (https://github.com/popgenmethods/pyrho) while using population-specific population size history estimates obtained from smc++ (https://github.com/popgenmethods/smcpp). Genetic maps are only available for the 22 autosomes. See https://doi.org/10.1126/sciadv.aaw9206 for more details.
Citations
Spence and Song, 2019. https://doi.org/10.1126/sciadv.aaw9206
PyrhoIBS_GRCh38
This genetic map was inferred using individuals from the IBS population from Phase 3 of the 1000 Genomes Project. Rates were estimated using pyrho (https://github.com/popgenmethods/pyrho) while using population-specific population size history estimates obtained from smc++ (https://github.com/popgenmethods/smcpp). Genetic maps are only available for the 22 autosomes. See https://doi.org/10.1126/sciadv.aaw9206 for more details.
Citations
Spence and Song, 2019. https://doi.org/10.1126/sciadv.aaw9206
PyrhoITU_GRCh38
This genetic map was inferred using individuals from the ITU population from Phase 3 of the 1000 Genomes Project. Rates were estimated using pyrho (https://github.com/popgenmethods/pyrho) while using population-specific population size history estimates obtained from smc++ (https://github.com/popgenmethods/smcpp). Genetic maps are only available for the 22 autosomes. See https://doi.org/10.1126/sciadv.aaw9206 for more details.
Citations
Spence and Song, 2019. https://doi.org/10.1126/sciadv.aaw9206
PyrhoJPT_GRCh38
This genetic map was inferred using individuals from the JPT population from Phase 3 of the 1000 Genomes Project. Rates were estimated using pyrho (https://github.com/popgenmethods/pyrho) while using population-specific population size history estimates obtained from smc++ (https://github.com/popgenmethods/smcpp). Genetic maps are only available for the 22 autosomes. See https://doi.org/10.1126/sciadv.aaw9206 for more details.
Citations
Spence and Song, 2019. https://doi.org/10.1126/sciadv.aaw9206
PyrhoKHV_GRCh38
This genetic map was inferred using individuals from the KHV population from Phase 3 of the 1000 Genomes Project. Rates were estimated using pyrho (https://github.com/popgenmethods/pyrho) while using population-specific population size history estimates obtained from smc++ (https://github.com/popgenmethods/smcpp). Genetic maps are only available for the 22 autosomes. See https://doi.org/10.1126/sciadv.aaw9206 for more details.
Citations
Spence and Song, 2019. https://doi.org/10.1126/sciadv.aaw9206
PyrhoLWK_GRCh38
This genetic map was inferred using individuals from the LWK population from Phase 3 of the 1000 Genomes Project. Rates were estimated using pyrho (https://github.com/popgenmethods/pyrho) while using population-specific population size history estimates obtained from smc++ (https://github.com/popgenmethods/smcpp). Genetic maps are only available for the 22 autosomes. See https://doi.org/10.1126/sciadv.aaw9206 for more details.
Citations
Spence and Song, 2019. https://doi.org/10.1126/sciadv.aaw9206
PyrhoMSL_GRCh38
This genetic map was inferred using individuals from the MSL population from Phase 3 of the 1000 Genomes Project. Rates were estimated using pyrho (https://github.com/popgenmethods/pyrho) while using population-specific population size history estimates obtained from smc++ (https://github.com/popgenmethods/smcpp). Genetic maps are only available for the 22 autosomes. See https://doi.org/10.1126/sciadv.aaw9206 for more details.
Citations
Spence and Song, 2019. https://doi.org/10.1126/sciadv.aaw9206
PyrhoMXL_GRCh38
This genetic map was inferred using individuals from the MXL population from Phase 3 of the 1000 Genomes Project. Rates were estimated using pyrho (https://github.com/popgenmethods/pyrho) while using population-specific population size history estimates obtained from smc++ (https://github.com/popgenmethods/smcpp). Genetic maps are only available for the 22 autosomes. See https://doi.org/10.1126/sciadv.aaw9206 for more details.
Citations
Spence and Song, 2019. https://doi.org/10.1126/sciadv.aaw9206
PyrhoPEL_GRCh38
This genetic map was inferred using individuals from the PEL population from Phase 3 of the 1000 Genomes Project. Rates were estimated using pyrho (https://github.com/popgenmethods/pyrho) while using population-specific population size history estimates obtained from smc++ (https://github.com/popgenmethods/smcpp). Genetic maps are only available for the 22 autosomes. See https://doi.org/10.1126/sciadv.aaw9206 for more details.
Citations
Spence and Song, 2019. https://doi.org/10.1126/sciadv.aaw9206
PyrhoPJL_GRCh38
This genetic map was inferred using individuals from the PJL population from Phase 3 of the 1000 Genomes Project. Rates were estimated using pyrho (https://github.com/popgenmethods/pyrho) while using population-specific population size history estimates obtained from smc++ (https://github.com/popgenmethods/smcpp). Genetic maps are only available for the 22 autosomes. See https://doi.org/10.1126/sciadv.aaw9206 for more details.
Citations
Spence and Song, 2019. https://doi.org/10.1126/sciadv.aaw9206
PyrhoPUR_GRCh38
This genetic map was inferred using individuals from the PUR population from Phase 3 of the 1000 Genomes Project. Rates were estimated using pyrho (https://github.com/popgenmethods/pyrho) while using population-specific population size history estimates obtained from smc++ (https://github.com/popgenmethods/smcpp). Genetic maps are only available for the 22 autosomes. See https://doi.org/10.1126/sciadv.aaw9206 for more details.
Citations
Spence and Song, 2019. https://doi.org/10.1126/sciadv.aaw9206
PyrhoSTU_GRCh38
This genetic map was inferred using individuals from the STU population from Phase 3 of the 1000 Genomes Project. Rates were estimated using pyrho (https://github.com/popgenmethods/pyrho) while using population-specific population size history estimates obtained from smc++ (https://github.com/popgenmethods/smcpp). Genetic maps are only available for the 22 autosomes. See https://doi.org/10.1126/sciadv.aaw9206 for more details.
Citations
Spence and Song, 2019. https://doi.org/10.1126/sciadv.aaw9206
PyrhoTSI_GRCh38
This genetic map was inferred using individuals from the TSI population from Phase 3 of the 1000 Genomes Project. Rates were estimated using pyrho (https://github.com/popgenmethods/pyrho) while using population-specific population size history estimates obtained from smc++ (https://github.com/popgenmethods/smcpp). Genetic maps are only available for the 22 autosomes. See https://doi.org/10.1126/sciadv.aaw9206 for more details.
Citations
Spence and Song, 2019. https://doi.org/10.1126/sciadv.aaw9206
PyrhoYRI_GRCh38
This genetic map was inferred using individuals from the YRI population from Phase 3 of the 1000 Genomes Project. Rates were estimated using pyrho (https://github.com/popgenmethods/pyrho) while using population-specific population size history estimates obtained from smc++ (https://github.com/popgenmethods/smcpp). Genetic maps are only available for the 22 autosomes. See https://doi.org/10.1126/sciadv.aaw9206 for more details.
Citations
Spence and Song, 2019. https://doi.org/10.1126/sciadv.aaw9206
Demographic Models
ID |
Description |
|---|---|
Three population out-of-Africa with an extended pulse of Neandertal admixture into Europeans |
|
Three population out-of-Africa |
|
Two population out-of-Africa |
|
African population |
|
American admixture |
|
Three population out-of-Africa with archaic admixture |
|
Periodic growth and decline. |
|
Multi-population model of ancient Eurasia |
|
Out-of-Africa with archaic admixture into Papuans |
|
Ashkenazi Jewish with substructure and European admixture |
|
4 population out of Africa |
|
African-americans population |
|
Multi-population model of ancient Europe |
Three population out-of-Africa with an extended pulse of Neandertal admixture into Europeans
Demographic model of an extended admixture pulse from Neandertals into Europeans taken from Iasi et al. (2021), specifically the simple model of Supplementary Figure 1a with a gamma-shaped pulse. This model simulates 3 populations: Africans, Europeans and Neandertals with an Out-of-Africa event. The population sizes are constant with an unidirectional admixture from Neandertals into Europeans after the split between Europeans and Africans. The admixture event is modelled as an 800 generation (20 ky) long extended admixture pulse.
Details
- ID:
OutOfAfricaExtendedNeandertalAdmixturePulse_3I21
- Description:
Three population out-of-Africa with an extended pulse of Neandertal admixture into Europeans
- Num populations:
3
Populations
Index |
ID |
Sampling time |
Description |
|---|---|---|---|
0 |
YRI |
0 |
1000 Genomes YRI (Yoruba) |
1 |
CEU |
0 |
1000 Genomes CEU (Utah Residents (CEPH) with Northern and Western European Ancestry) |
2 |
NEA |
0 |
Neandertals |
Citations
Iasi et al., 2021. https://doi.org/10.1093/molbev/msab210
Demographic Model parameters
Parameter Type (units) |
Value |
Description |
|---|---|---|
Population size |
10000 |
YRI pop. size |
Population size |
10000 |
CEU pop. size |
Population size |
10000 |
Neandertal pop. size |
Total migration rate |
0.029 |
Neandertal-CEU total migration rate over the extended admixture pulse |
Time (kya) |
290 |
Neandertal Human split |
Time (kya) |
73.95 |
Time of OOA event |
Time (kya) |
50 |
Neandertal migrations starts |
Time (kya) |
30 |
Neandertal migrations end |
Generation time (yrs.) |
29 |
Generation time |
Mutation rate |
2e-8 |
Per-base per-generation mutation rate |
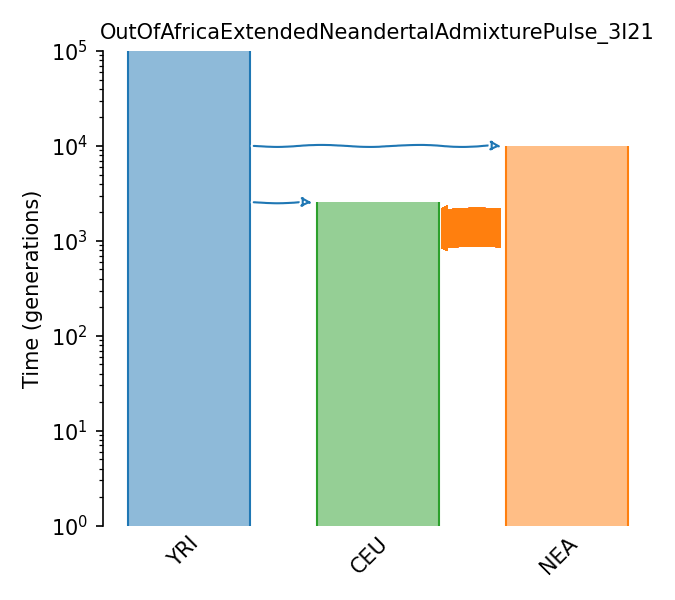
Three population out-of-Africa
The three population Out-of-Africa model from Gutenkunst et al. 2009. It describes the ancestral human population in Africa, the out of Africa event, and the subsequent European-Asian population split. Model parameters are the maximum likelihood values of the various parameters given in Table 1 of Gutenkunst et al.
Details
- ID:
OutOfAfrica_3G09
- Description:
Three population out-of-Africa
- Num populations:
3
Populations
Index |
ID |
Sampling time |
Description |
|---|---|---|---|
0 |
YRI |
0 |
1000 Genomes YRI (Yoruba) |
1 |
CEU |
0 |
1000 Genomes CEU (Utah Residents (CEPH) with Northern and Western European Ancestry) |
2 |
CHB |
0 |
1000 Genomes CHB (Han Chinese in Beijing, China) |
Citations
Gutenkunst et al., 2009. https://doi.org/10.1371/journal.pgen.1000695
Demographic Model parameters
Parameter Type (units) |
Value |
Description |
|---|---|---|
Population size |
7,300 |
Ancestral pop. size |
Population size |
12,300 |
YRI pop. size |
Population size |
2,100 |
OOA pop. size |
Population size |
1,000 |
CEU pop. size after EU/AS divergence |
Population size |
510 |
CHB pop. size after EU/AS divergence |
Growth rate (per gen.) |
0.004 |
CEU pop. growth rate (per gen.) |
Growth rate (per gen.) |
0.0055 |
CHB pop. growth rate (per gen.) |
Migration rate (x10^-5) |
25 |
YRI-OOA migration rate (per gen.) |
Migration rate (x10^-5) |
3 |
YRI-CEU migration rate (per gen.) |
Migration rate (x10^-5) |
1.9 |
YRI-CHB migration rate (per gen.) |
Migration rate (x10^-5) |
9.6 |
CEU-CHB migration rate (per gen.) |
Epoch Time (gen.) |
8,800 |
Expansion time of ancestral pop. |
Epoch Time (gen.) |
5,600 |
Time of OOA event |
Epoch Time (gen.) |
848 |
Time of CEU-CHB split |
Generation time (yrs.) |
25 |
Generation time |
Mutation rate |
2.35e-8 |
Per-base per-generation mutation rate |
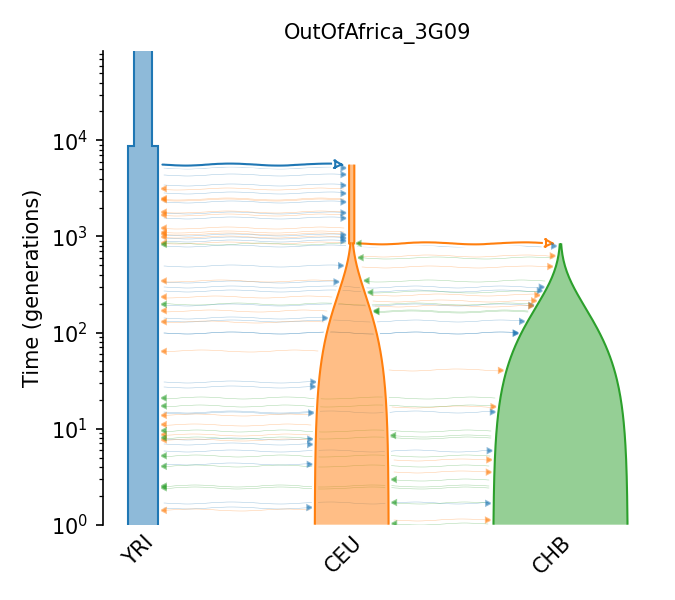
Two population out-of-Africa
The model is derived from the Tennessen et al. analysis of the jSFS from European Americans and African Americans. It describes the ancestral human population in Africa, the out of Africa event, and two distinct periods of subsequent European population growth over the past 23kya. Model parameters are taken from Fig. S5 in Fu et al.
Details
- ID:
OutOfAfrica_2T12
- Description:
Two population out-of-Africa
- Num populations:
2
Populations
Index |
ID |
Sampling time |
Description |
|---|---|---|---|
0 |
AFR |
0 |
African Americans |
1 |
EUR |
0 |
European Americans |
Citations
Tennessen et al., 2012. https://doi.org/10.1126/science.1219240
Fu et al., 2013. https://doi.org/10.1038/nature11690
Demographic Model parameters
Parameter Type (units) |
Value |
Description |
|---|---|---|
Population size |
7,310 |
Ancestral pop. size |
Population size |
14,474 |
AFR pop. size |
Population size |
1,861 |
OOA pop. size |
Population size |
1,032 |
EU pop. size after EU/AS divergence |
Population size |
9,279 |
EU pop. size after 1st expansion |
Population size |
501,436 |
EU pop. size after 2nd expansion |
Population size |
432,125 |
AFR pop. size after 1st expansion |
Growth rate (per gen.) |
0.00307 |
EU pop. growth rate 1st expansion |
Growth rate (per gen.) |
0.0195 |
EU pop. growth rate 2st expansion |
Growth rate (per gen.) |
0.0166 |
AFR pop. growth rate 1st expansion |
Migration rate (x10^-5 per gen.) |
15 |
AFR-OOA migration rate |
Migration rate (x10^-5 per gen.) |
2.5 |
AFR-EU migration rate (both expansions) |
Epoch Time (gen.) |
5,920 |
Expansion time of ancestral pop. |
Epoch Time (gen.) |
2,040 |
Time of OOA event |
Epoch Time (gen.) |
920 |
Beginning of 1st EU growth period |
Epoch Time (gen.) |
204.6 |
Beginning of 2nd EU/1st AFR growth period |
Generation time (yrs.) |
25 |
Generation time |
Mutation rate |
2.36e-8 |
Per-base per-generation mutation rate |
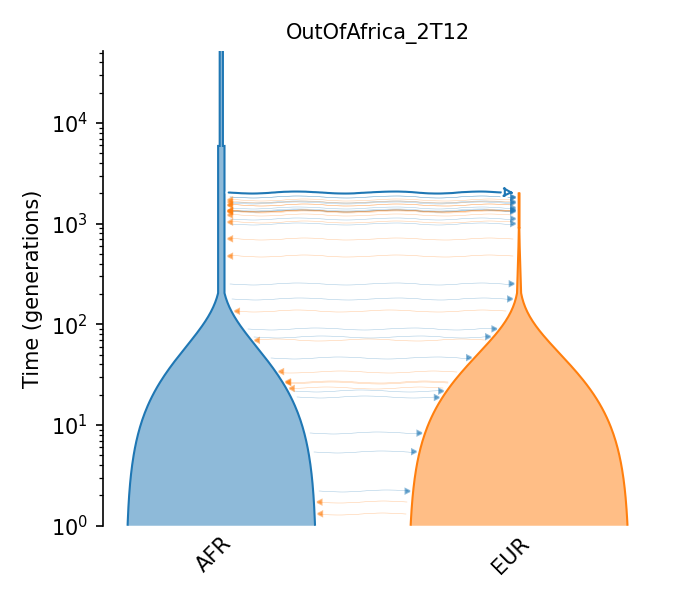
African population
The model is a simplification of the two population Tennesen et al. model with the European-American population removed so that we are modeling the African population in isolation.
Details
- ID:
Africa_1T12
- Description:
African population
- Num populations:
1
Populations
Index |
ID |
Sampling time |
Description |
|---|---|---|---|
0 |
AFR |
0 |
African |
Citations
Tennessen et al., 2012. https://doi.org/10.1126/science.1219240
Demographic Model parameters
Parameter Type (units) |
Value |
Description |
|---|---|---|
Population size |
7,310 |
Ancestral pop. size |
Population size |
14,474 |
AFR pop. size |
Population size |
432,125 |
AFR pop. size after 1st expansion |
Growth rate (per gen.) |
0.0166 |
AFR pop. growth rate 1st expansion |
Epoch Time (gen.) |
5,920 |
Expansion time of ancestral pop. |
Epoch Time (gen.) |
204.6 |
Beginning of AFR growth period |
Generation time (yrs.) |
25 |
Generation time |
Mutation rate |
2.36e-8 |
Per-base per-generation mutation rate |
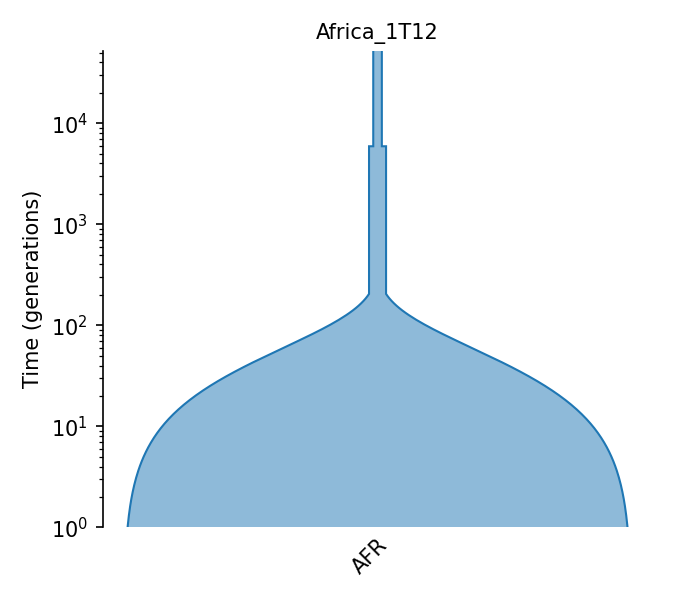
American admixture
Demographic model for American admixture, taken from Browning et al. 2018. This model extends the Gravel et al. (2011) model of African/European/Asian demographic history to simulate an admixed population with admixture occurring 12 generations ago. The admixed population had an initial size of 30,000 and grew at a rate of 5% per generation, with 1/6 of the population of African ancestry, 1/3 European, and 1/2 Asian. Note that this demographic model was not inferred, and the mutation rate that Browning et al. used for simulation is smaller than used for inferring the model, so the mutation rate provided here is that from Gravel et al.
Details
- ID:
AmericanAdmixture_4B18
- Description:
American admixture
- Num populations:
4
Populations
Index |
ID |
Sampling time |
Description |
|---|---|---|---|
0 |
AFR |
0 |
Contemporary African population |
1 |
EUR |
0 |
Contemporary European population |
2 |
ASIA |
0 |
Contemporary Asian population |
3 |
ADMIX |
0 |
Modern admixed population |
Citations
Browning et al., 2018. http://dx.doi.org/10.1371/journal.pgen.1007385
Gravel et al., 2011. https://doi.org/10.1073/pnas.1019276108
Demographic Model parameters
Parameter Type (units) |
Value |
Description |
|---|---|---|
Population size |
7,310 |
Ancestral pop. size |
Population size |
14,474 |
AFR pop. size |
Population size |
1,861 |
OOA pop. size |
Population size |
1,032 |
EU pop. size after EU/AS divergence |
Population size |
554 |
ASN pop. size after EU/AS divergence |
Population size |
30,000 |
Initial ADMIX pop. size |
Growth rate (per gen.) |
0.0038 |
EU pop. growth rate (per gen.) |
Growth rate (per gen.) |
0.0048 |
ASN pop. growth rate (per gen.) |
Growth rate (per gen.) |
0.05 |
ADMIX pop. growth rate (per gen.) |
Migration rate (x10^-5) |
15 |
AFR-OOA migration rate (per gen.) |
Migration rate (x10^-5) |
2.5 |
AFR-EU migration rate (per gen.) |
Migration rate (x10^-5) |
0.78 |
AFR-ASN migration rate (per gen.) |
Migration rate (x10^-5) |
3.11 |
EU-ASN migration rate (per gen.) |
Epoch Time (gen.) |
5,920 |
Expansion time of ancestral pop. |
Epoch Time (gen.) |
2,040 |
Time of OOA event |
Epoch Time (gen.) |
920 |
Time of EU-ASN split |
Epoch Time (gen.) |
12 |
Time of ADMIX population emergence |
ADMIX percentage |
1/6 |
Amount African admixture |
ADMIX percentage |
1/3 |
Amount European admixture |
ADMIX percentage |
1/2 |
Amount Asian admixture |
Generation time (yrs.) |
25 |
Generation time |
Mutation rate |
2.36e-8 |
Per-base per-generation mutation rate |
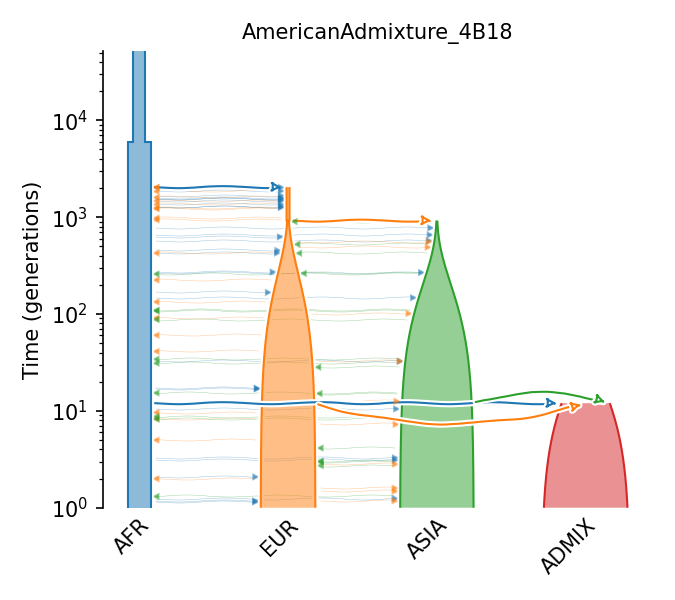
Three population out-of-Africa with archaic admixture
The three population out-of-African model popularized by Gutenkunst et al. (2009) and augmented by archaic contributions to both Eurasian and African populations. Two archaic populations split early in human history, before the African expansion, and contribute to Eurasian populations (putative Neanderthal branch) and to the African branch (a deep diverging branch within Africa). Admixture is modeled as symmetric migration between the archaic and modern human branches, with contribution ending at a given time in the past.
Details
- ID:
OutOfAfricaArchaicAdmixture_5R19
- Description:
Three population out-of-Africa with archaic admixture
- Num populations:
5
Populations
Index |
ID |
Sampling time |
Description |
|---|---|---|---|
0 |
YRI |
0 |
1000 Genomes YRI (Yoruba) |
1 |
CEU |
0 |
1000 Genomes CEU (Utah Residents (CEPH) with Northern and Western European Ancestry) |
2 |
CHB |
0 |
1000 Genomes CHB (Han Chinese in Beijing, China) |
3 |
Neanderthal |
None |
Putative Neanderthals |
4 |
ArchaicAFR |
None |
Putative Archaic Africans |
Citations
Ragsdale and Gravel, 2019. https://doi.org/10.1371/journal.pgen.1008204
Demographic Model parameters
Parameter Type (units) |
Value |
Description |
|---|---|---|
Population size |
3,600 |
Ancestral pop. size |
Population size |
13,900 |
YRI pop. size |
Population size |
880 |
OOA pop. size |
Population size |
2,300 |
CEU pop. size after EU/AS divergence |
Population size |
650 |
CHB pop. size after EU/AS divergence |
Growth rate (per gen.) |
0.00125 |
CEU pop. growth rate (per gen.) |
Growth rate (per gen.) |
0.00372 |
CHB pop. growth rate (per gen.) |
Migration rate (x10^-5) |
52.2 |
YRI-OOA migration rate (per gen.) |
Migration rate (x10^-5) |
2.48 |
YRI-CEU migration rate (per gen.) |
Migration rate (x10^-5) |
0 |
YRI-CHB migration rate (per gen.) |
Migration rate (x10^-5) |
11.3 |
CEU-CHB migration rate (per gen.) |
Time (kya) |
300 |
Expansion time of ancestral pop. |
Time (kya) |
60.7 |
Time of OOA event |
Time (kya) |
36 |
Time of CEU-CHB split |
Time (kya) |
499 |
Archaic African split time |
Time (kya) |
125 |
Archaic African migration begins |
Migration rate (x10^-5) |
1.98 |
Arch Afr-Nean migration rate (per gen.) |
Time (kya) |
559 |
Neanderthal split time |
Migration rate (x10^-5) |
0.825 |
OOA pops-Nean migration rate (per gen.) |
Time (kya) |
18.7 |
Archaic migrations end |
Generation time (yrs.) |
29 |
Generation time |
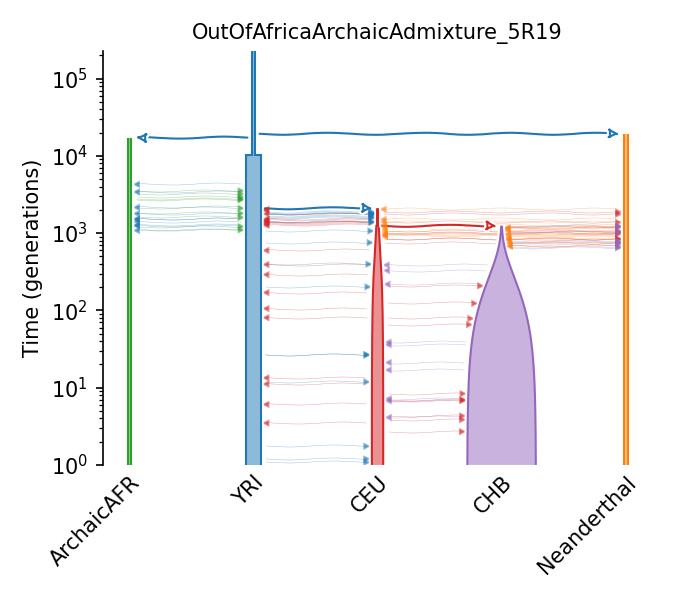
Periodic growth and decline.
A validation model used by Schiffels and Durbin (2014) and Terhorst and Terhorst, Kamm, and Song (2017) with periods of exponential growth and decline in a single population.
Details
- ID:
Zigzag_1S14
- Description:
Periodic growth and decline.
- Num populations:
1
Populations
Index |
ID |
Sampling time |
Description |
|---|---|---|---|
0 |
generic |
0 |
Generic expanding and contracting population |
Citations
Schiffels and Durbin, 2014. https://doi.org/10.1038/ng.3015
Demographic Model parameters
Parameter Type (units) |
Value |
Description |
|---|---|---|
Population size |
7,156 |
Ancient pop. size |
Population size |
71,560 |
Recent pop. size |
Growth rate (per gen.) |
8.99448 x 10^(-5) |
Growth rate for 1st growth |
Growth rate (per gen.) |
-0.00035977 |
Growth rate for 1st decline |
Growth rate (per gen.) |
0.0014391 |
Growth rate for 2nd growth |
Growth rate (per gen.) |
-0.005756 |
Growth rate for 2rd decline |
Growth rate (per gen.) |
0.023025 |
Growth rate for 3st growth |
Time (gen.) |
34,133.31 |
Beginning of 1st growth |
Time (gen.) |
8,533.33 |
Beginning of 1st decline |
Time (gen.) |
2,133.33 |
Beginning of 2nd growth |
Time (gen.) |
533.33 |
Beginning of 2nd decline |
Time (gen.) |
133.33 |
Beginning of 3rd growth |
Time (gen.) |
33.333 |
End of 3rd growth |
Generation time |
30 |
Generation time in years |
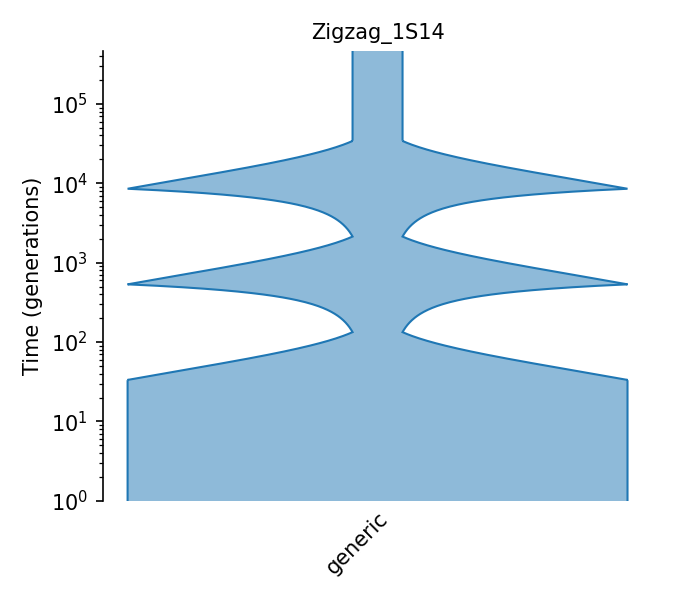
Multi-population model of ancient Eurasia
This is the best-fitting model of a history of multiple ancient and present-day human populations sampled across Eurasia over the past 120,000 years. The fitting was performed using momi2 (Kamm et al. 2019), which uses the multi-population site-frequency spectrum as input data. The model includes a ghost admixture event (from unsampled basal Eurasians into early European farmers), and two admixture events where the source is approximately well-known (from Neanderthals into Non-Africans and from Western European hunter-gatherers into modern Sardinians. There are three present-day populations: Sardinians, Han Chinese and African Mbuti. Additionally, there are several ancient samples obtained from fossils dated at different times in the past: the Altai Neanderthal (Prufer et al. 2014), a Mesolithic hunter-gatherer (Lazaridis et al. 2014), a Neolithic early European sample (Lazaridis et al. 2014), and two Palaeolithic modern humans from Siberia - MA1 (Raghavan et al. 2014) and Ust’Ishim (Fu et al. 2014). All the ancient samples are represented by a single diploid genome.
Details
- ID:
AncientEurasia_9K19
- Description:
Multi-population model of ancient Eurasia
- Num populations:
9
Populations
Index |
ID |
Sampling time |
Description |
|---|---|---|---|
0 |
Mbuti |
0 |
Present-day African Mbuti |
1 |
LBK |
320 |
Early European farmer (EEF) |
2 |
Sardinian |
0 |
Present-day Sardinian |
3 |
Loschbour |
300 |
Western hunter-gatherer (WHG) |
4 |
MA1 |
960 |
Upper Palaeolithic MAl’ta culture |
5 |
Han |
0 |
Present-day Han Chinese |
6 |
UstIshim |
1800 |
early Palaeolithic Ust’-Ishim |
7 |
Neanderthal |
2000 |
Altai Neanderthal from Siberia |
8 |
BasalEurasian |
None |
Basal Eurasians |
Citations
Kamm et al., 2019. https://doi.org/10.1080/01621459.2019.1635482
Demographic Model parameters
Parameter Type (units) |
Value |
Description |
|---|---|---|
Population size |
17,300 |
Mbuti pop. size |
Population size |
75.7 |
EEF pop. size |
Population size |
15,000 |
Sardinian pop. size |
Population size |
1,920 |
Size of WHG, Bazal, Mal’ta and Ust’-Ishim populations |
Population size |
6,300 |
Han Chinese pop. size |
Population size |
86.9 |
Neanderthal pop. size after exp. decline |
Population size |
2,340 |
(WHG + Han chinese) pop. size before divergence |
Population size |
29,100 |
(WHG + Mbuti) pop. size before divergence |
Population size |
18,200 |
Ancestral pop. size and Nean. size before exp. decline |
Population size |
12,000 |
(Sardinian + EEF) pop. size before divergence |
Time (yrs.) |
696,000 |
Time of WHG and Neanderthal split |
Time (yrs.) |
95,800 |
Time of WHG and Mbuti split, start of Nean. decline |
Time (yrs.) |
79,800 |
Time of WHG and Bazal split |
Time (yrs.) |
51,500 |
Time of WHG and Ust’Ishim split |
Time (yrs.) |
50,400 |
Time of WHG and Han Chinese split |
Time (yrs.) |
44,900 |
Time of WHG and Mal’ta split |
Time (yrs.) |
37,700 |
Time of WHG and EEF split |
Time (yrs.) |
7,690 |
Time of EEF and Sardinian split |
Time (yrs.) |
56,800 |
Time of Neanderthal to Eurasian (WHG) admixture |
Time (yrs.) |
33,700 |
Time of Bazal to EEF admixture |
Time (yrs.) |
1,230 |
Time of WHG to Sardinian admixture |
ADMIX percentage |
2.96 |
Amount of Neanderthal admixture in Eurasian pop. |
ADMIX percentage |
9.36 |
Amount of Bazal admixture in EEF pop. |
ADMIX percentage |
3.17 |
Amount of WHG admixture in Sardinian pop. |
Time (yrs.) |
8,000 |
Time of EEF samples |
Time (yrs.) |
7,500 |
Time of WHG samples |
Time (yrs.) |
24,000 |
Time of MAl’ta samples |
Time (yrs.) |
45,000 |
Time of Ust’-Ishim samples |
Time (yrs.) |
50,000 |
Time of Neanderthal samples |
Generation time (yrs.) |
25 |
Generation time |
Mutation rate |
1.22e-8 |
Per-base per-generation mutation rate |
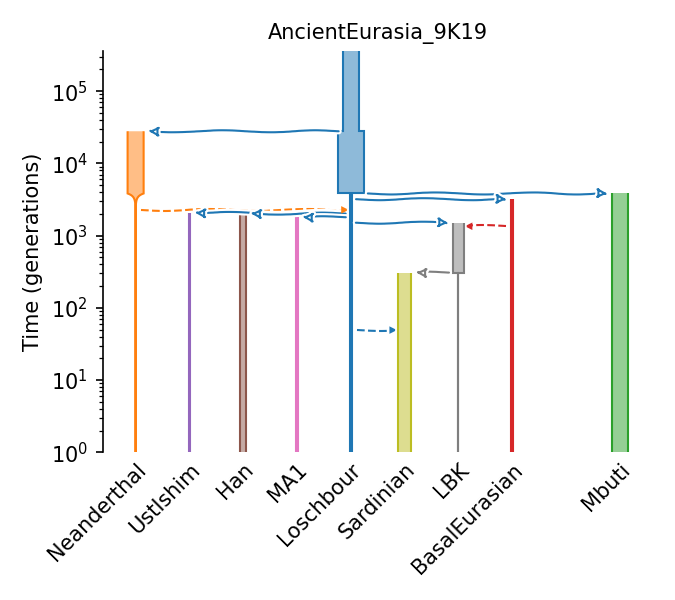
Out-of-Africa with archaic admixture into Papuans
A ten population model of out-of-Africa, including two pulses of Denisovan admixture into Papuans, and several pulses of Neandertal admixture into non-Africans. Most parameters are from Jacobs et al. (2019), Table S5 and Figure S5. This model is an extension of one from Malaspinas et al. (2016), thus some parameters are inherited from there.
Details
- ID:
PapuansOutOfAfrica_10J19
- Description:
Out-of-Africa with archaic admixture into Papuans
- Num populations:
10
Populations
Index |
ID |
Sampling time |
Description |
|---|---|---|---|
0 |
YRI |
0 |
1000 Genomes YRI (Yoruba) |
1 |
CEU |
0 |
1000 Genomes CEU (Utah Residents (CEPH) with Northern and Western European Ancestry) |
2 |
CHB |
0 |
1000 Genomes CHB (Han Chinese in Beijing, China) |
3 |
Papuan |
0 |
Papuans from Indonesia and New Guinea |
4 |
DenA |
2058 |
Altai Denisovan (sampling) lineage |
5 |
NeaA |
2612 |
Altai Neandertal (sampling) lineage |
6 |
Den1 |
None |
Denisovan D1 (introgressing) lineage |
7 |
Den2 |
None |
Denisovan D2 (introgressing) lineage |
8 |
Nea1 |
None |
Neandertal N1 (introgressing) lineage |
9 |
Ghost |
None |
Out-of-Africa lineage |
Citations
Jacobs et al., 2019. https://doi.org/10.1016/j.cell.2019.02.035
Malaspinas et al., 2016. https://doi.org/10.1038/nature18299
Demographic Model parameters
Parameter Type (units) |
Value |
Description |
|---|---|---|
Population size |
48,433 |
African pop. size |
Population size |
6,962 |
European pop. size |
Population size |
9,025 |
East Asian pop. size |
Population size |
8,834 |
Papuan pop. size |
Population size |
5,083 |
Altai Denisovan pop. size |
Population size |
826 |
Altai Neandertal pop. size |
Population size |
13,249 |
Introgressing Denisovan D1 pop. size |
Population size |
13,249 |
Introgressing Denisovan D2 pop. size |
Population size |
13,249 |
Introgressing Neandertal pop. size |
Population size |
8,516 |
Ghost (out-of-Africa lineage) pop. size |
Population size |
12,971 |
(European + East Asian) pop. size before divergence |
Population size |
41,563 |
(Ghost + African) pop. size before divergence |
Population size |
13,249 |
(Denisovan + Neandertal) pop. size before divergence |
Population size |
32,671 |
(Human + Archaic) pop. size before divergence |
Population size |
100 |
(Altai Denisovan + Introgressing Denisovan D1) pop. size before divergence |
Population size |
100 |
(Altai Denisovan + Introgressing Denisovan D2) pop. size before divergence |
Population size |
13,249 |
(Altai Neandertal + Introgressing Neandertal) pop. size before divergence |
Time (yrs.) |
37,497 |
Time of European and East Asian split |
Time (yrs.) |
50,982 |
Time of Ghost and (European + East Asian) split |
Time (yrs.) |
51,736 |
Time of Ghost and Papuan split |
Time (yrs.) |
64,322 |
Time of Ghost and African split |
Time (yrs.) |
97,875 |
Time of Altai Neandertal and Introgressing Neandertal split |
Time (yrs.) |
282,750 |
Time of Altai Denisovan and Introgressing Denisovan D1 split |
Time (yrs.) |
362,500 |
Time of Altai Denisovan and Introgressing Denisovan D2 split |
Time (yrs.) |
437,610 |
Time of Denisovan and Neandertal split |
Time (yrs.) |
586,525 |
Time of Human and Archaic split |
Population size |
2,231 |
(European + East Asian) bottleneck pop. size |
Population size |
243 |
Papuan bottleneck pop. size |
Population size |
1,394 |
Ghost (out-of-Africa) bottleneck pop. size |
Time (yrs.) |
48,111 |
Time of the (European + East Asian) bottleneck |
Time (yrs.) |
48,865 |
Time of the Papuan bottleneck |
Time (yrs.) |
61,451 |
Time of the Ghost (out-of-Africa) bottleneck |
ADMIX percentage |
2.2 |
Amount of Denisovan D1 admixture in Papaun pop. |
ADMIX percentage |
1.8 |
Amount of Denisovan D2 admixture in Papaun pop. |
ADMIX percentage |
2.4 |
Amount of Neandertal admixture in Ghost pop. |
ADMIX percentage |
1.1 |
Amount of Neandertal admixture in (European + East Asian) pop. |
ADMIX percentage |
0.2 |
Amount of Neandertal admixture in Papuan pop. |
ADMIX percentage |
0.2 |
Amount of Neandertal admixture in East Asian pop. |
Time (yrs.) |
29,800 |
Time of Denisovan D1 to Papuan admixture |
Time (yrs.) |
45,700 |
Time of Denisovan D2 to Papuan admixture |
Time (yrs.) |
53,737 |
Time of Neandertal to Ghost admixture |
Time (yrs.) |
45,414 |
Time of Neandertal to (European + East Asian) admixture |
Time (yrs.) |
40,948 |
Time of Neandertal to Papuan admixture |
Time (yrs.) |
25,607 |
Time of Neandertal to East Asian admixture |
Migration rate (x10^-4) |
1.79 |
Ghost–African migration rate |
Migration rate (x10^-4) |
4.42 |
Ghost–European migration rate |
Migration rate (x10^-5) |
3.14 |
European–East Asian migration rate |
Migration rate (x10^-5) |
5.72 |
East Asian–Papuan migration rate |
Migration rate (x10^-4) |
5.72 |
(European + East Asian)–Papuan migration rate |
Migration rate (x10^-4) |
4.42 |
(European + East Asian)–Ghost migration rate |
Time (yrs.) |
37,497 |
(European + East Asian)–Papuan migration begins |
Time (yrs.) |
37,497 |
(European + East Asian)–Ghost migration begins |
Generation time (yrs.) |
29 |
Generation time |
Mutation rate |
1.4e-8 |
Per-base per-generation mutation rate |
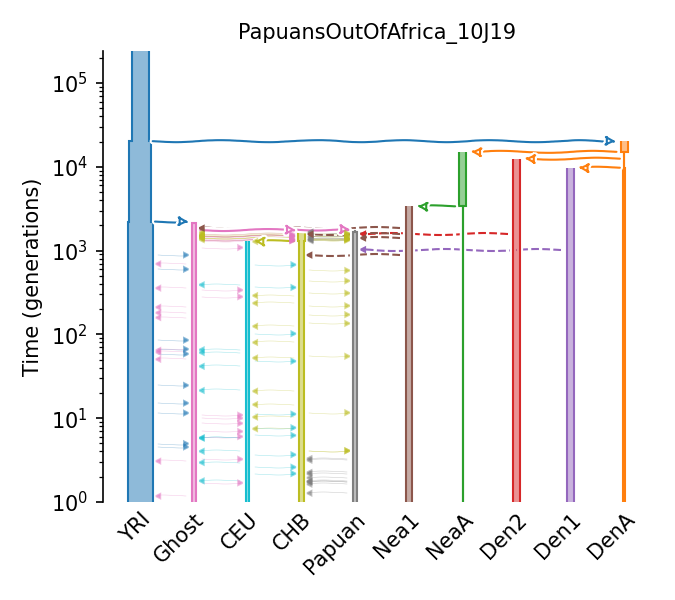
Ashkenazi Jewish with substructure and European admixture
This was the best fit model of Ashkenazi Jewish demographic history from Gladstein and Hammer 2019, shown in Figure 1, labeled “Substructure Model”. Model choice and parameter estimation were performed with Approximate Bayesian Computation. Parameter values are based on the mode from ABC found in Table S3 of Gladstein and Hammer 2019. In this model, the ancestors of Europeans and Middle Eastern populations diverge. Non-Ashkenazi Jewish populations then diverge from the Middle Eastern population. The Ashkenazi Jews then diverge from the other Jewish populations and experience a substantial reduction in population size and a single pulse of gene flow from Europeans (corresponding to their arrival in Europe). After the gene flow from Europeans to the Ashkenazi Jews, the Ashkenazi Jews split into two groups, the Western and Eastern. Finally, the Western Ashkenazi Jews experience moderate instantaneous population size increase, and the Eastern experience a massive population size increase. In addition to the demographic model Gladstein and Hammer 2019 also incorporated an SNP array ascertainment scheme into the simulation. This demographic model does not include the SNP array ascertainment scheme. It should be noted that Gladstein and Hammer 2019 simulated with a mutation rate of 2.5e-8.
Details
- ID:
AshkSub_7G19
- Description:
Ashkenazi Jewish with substructure and European admixture
- Num populations:
7
Populations
Index |
ID |
Sampling time |
Description |
|---|---|---|---|
0 |
YRI |
0 |
1000 Genomes YRI (Yoruba) |
1 |
CHB |
0 |
1000 Genomes CHB (Han Chinese in Beijing, China) |
2 |
CEU |
0 |
1000 Genomes CEU (Utah Residents (CEPH) with Northern and Western European Ancestry) |
3 |
ME |
0 |
Middle Eastern |
4 |
J |
0 |
non-Ashkenazi Jewish |
5 |
WAJ |
0 |
Western Ashkenazi Jewish |
6 |
EAJ |
0 |
Eastern Ashkenazi Jewish |
Citations
Gladstein and Hammer, 2019. https://doi.org/10.1093/molbev/msz047
Demographic Model parameters
Parameter Type (units) |
Value |
Description |
|---|---|---|
Population size |
7,300 |
Ancestral African pop. size |
Population size |
18,197 |
YRI pop. size |
Population size |
4,073 |
CHB pop. size |
Population size |
33,113 |
CEU pop. size |
Population size |
436,515 |
Middle Eastern pop. size |
Population size |
354,813 |
non-AJ Jewish pop. size |
Population size |
6,606 |
Western AJ pop. size |
Population size |
1,949,844 |
Eastern AJ founder pop. size |
Epoch Time (gen.) |
8,800 |
Expansion time of YRI ancestral pop. |
Epoch Time (gen.) |
2,105 |
Time of OOA event |
Epoch Time (gen.) |
850 |
Time of CEU-CHB split |
Epoch Time (gen.) |
481 |
Time of Middle Eastern-CEU split |
Epoch Time (gen.) |
211 |
Time of Jewish-Middle Eastern split |
Epoch Time (gen.) |
29 |
Time of AJ-Jewish split |
Epoch Time (gen.) |
28 |
Time of geneflow (not inferred) |
Epoch Time (gen.) |
14 |
Time of Eastern-Western AJ split |
Epoch Time (gen.) |
13 |
Time of AJ growth (not inferred) |
ADMIX percentage |
0.17 |
European to AJ gene flow |
Generation time (yrs.) |
25 |
Generation time |
Mutation rate |
2.5e-8 |
Per-base per-generation mutation rate |
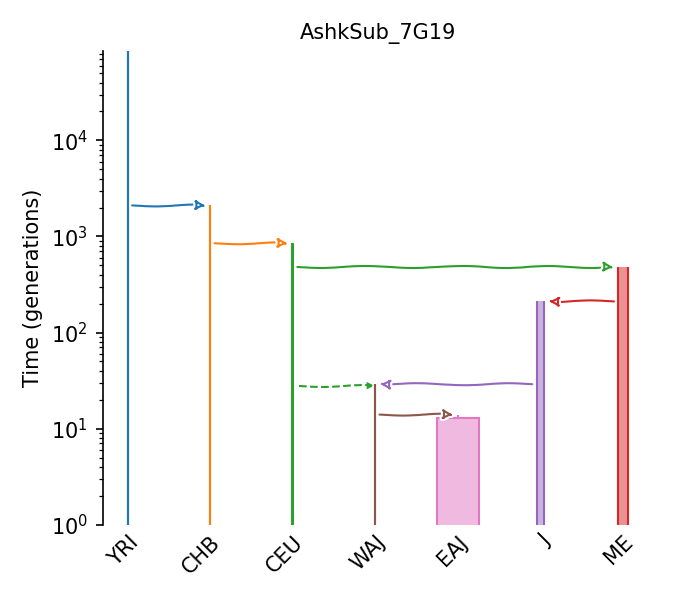
4 population out of Africa
Demographic model for a four population out-of-Africa history, taken from Jouganous et al. (2017). Parameter values were taken from table 4 in the main text. This model was fit based on joint allele frequecy spectrum (AFS) data from 1000 Genomes exomes from the YRI, CEU, CHB, and JPT poulation samples. The demography follows the previous three-populations out-of-Africa models with an additional population split in Asia leading to the Japanese (JPT) population. Parameter values were estimated with the program Moments assuming a mutation rate of 1.44e-8 and a generation time of 29 years.
Details
- ID:
OutOfAfrica_4J17
- Description:
4 population out of Africa
- Num populations:
4
Populations
Index |
ID |
Sampling time |
Description |
|---|---|---|---|
0 |
YRI |
0 |
1000 Genomes YRI (Yoruba) |
1 |
CEU |
0 |
1000 Genomes CEU (Utah Residents (CEPH) with Northern and Western European Ancestry) |
2 |
CHB |
0 |
1000 Genomes CHB (Han Chinese in Beijing, China) |
3 |
JPT |
0 |
1000 Genomes JPT (Japanese in Tokyo, Japan) |
Citations
Jouganous et al., 2017. https://doi.org/10.1534/genetics.117.200493
Demographic Model parameters
Parameter Type (units) |
Value |
Description |
|---|---|---|
Population size (individuals) |
11293 |
A (ancestral) population size |
Population size (individuals) |
23721 |
YRI population size |
Population size (individuals) |
2831 |
B (OOA) population size |
Population size (individuals) |
2512 |
CEU (European) initial pop. size after EU/AS divergence |
Population size (individuals) |
1019 |
CHB (Asian) initial pop. size after EU/AS divergence |
Population size (individuals) |
4384 |
JPT (Japanese ) pop. size after split from CHB |
Growth rate (percent per generation) |
0 |
A growth rate |
Growth rate (percent per generation) |
0 |
YRI growth rate |
Growth rate (percent per generation) |
0 |
B growth rate |
Growth rate (percent per generation) |
0.16 |
CEU growth rate |
Growth rate (percent per generation) |
0.26 |
CHB growth rate |
Growth rate (percent per generation) |
1.29 |
JPT growth rate |
Migration rate (fraction per generation) |
16.8e-5 |
YRI-B migration rate |
Migration rate (fraction per generation) |
1.14e-5 |
YRI-CEU migration rate |
Migration rate (fraction per generation) |
0.56e-5 |
YRI-CHB migration rate |
Migration rate (fraction per generation) |
4.75e-5 |
CEU-CHB migration rate |
Migration rate (fraction per generation) |
3.3e-5 |
CHB-JPT migration rate |
Epoch Time (thousands of years ago) |
357 |
Expansion time of ancestral population |
Epoch Time (thousands of years ago) |
119 |
Time of OOA event |
Epoch Time (thousands of years ago) |
46 |
Time of CEU-CHB split |
Epoch Time (thousands of years ago) |
9 |
Time of CHB-JPT split |
Generation time (years) |
29 |
Years per generation |
Mutation rate |
1.44e-8 |
Per-base per-generation mutation rate |
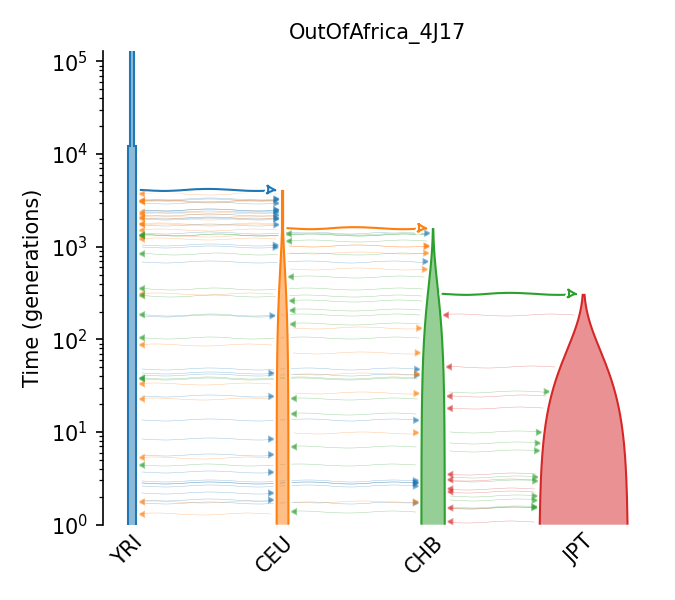
African-americans population
African-American two-epoch instantaneous growth model from Boyko et al 2008, fit to the synonymous SFS for the 11 of 15 African Americans showing the least European ancestry, using coalescent simulations with recombination with the maximum likelihood method of Williamson et al 2005; times were calibrated assuming 3e5 generations since human-chimp divergence and fitting the number of synonymous human-chimp differences. Mutation and recombination rates were assumed to be the same (1.8e-8).
Details
- ID:
Africa_1B08
- Description:
African-americans population
- Num populations:
1
Populations
Index |
ID |
Sampling time |
Description |
|---|---|---|---|
0 |
African_Americans |
0 |
African-Americans from Boyko et al 2008 |
Citations
Boyko et al., 2008. https://doi.org/10.1371/journal.pgen.1000083
Demographic Model parameters
Parameter Type (units) |
Value |
Description |
|---|---|---|
Population size |
7,778 |
Ancestral pop. size |
Population size |
25,636 |
African-americans current pop. size |
Epoch Time (gen.) |
6,809 |
instantaneous expansion time of ancestral pop. |
Mutation rate |
1.80E-08 |
Per-base per-generation mutation rate |
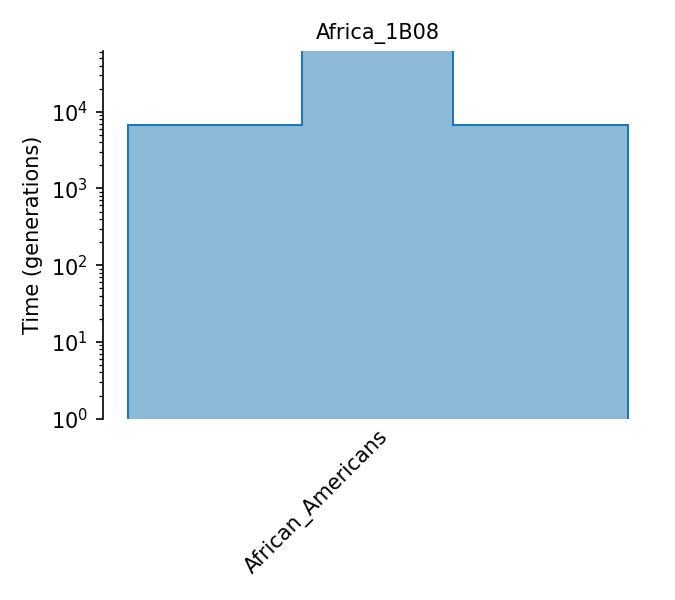
Multi-population model of ancient Europe
Population structure that has existed over the last 45,000 years in Europe, leading to modern Europeans. The model demonstrates the divergence of a Basal European Lineages into four ancient populations; Western, Eastern and Caucasus Hunter- Gatherers and Anatolian Farmers. Migration of Anatolian farmers into Western Europe and admixture with Western Hunter-Gatherers produces the European Neolithic Farmers. In West Asia the admixture of Eastern Hunter-Gatherers and Caucasus Hunter- Gatherers leads to the formation of the Yamnaya Steppe population. The Yamnaya migrate into Western Europe to admixture with the Neolithic farmers giving rise to Bronze Age europeans. There is only an exponential growth in population size from then to the Present-day. Samples are taken at multiple point throughout history from each population.
Details
- ID:
AncientEurope_4A21
- Description:
Multi-population model of ancient Europe
- Num populations:
10
Populations
Index |
ID |
Sampling time |
Description |
|---|---|---|---|
0 |
OOA |
1500 |
Basal/OOA |
1 |
NE |
600 |
Northern European |
2 |
WA |
800 |
West Asian |
3 |
CHG |
300 |
Caucasus Hunter-gathers |
4 |
ANA |
260 |
Anatolian |
5 |
WHG |
250 |
Western Hunter-gathers |
6 |
EHG |
250 |
Eastern Hunter-gathers |
7 |
YAM |
160 |
Yamnaya |
8 |
NEO |
180 |
Neolithic |
9 |
Bronze |
135 |
Bronze Age |
Citations
Allentoft et al., 2022. https://doi.org/10.1101/2022.05.04.490594
Demographic Model parameters
Parameter Type (units) |
Value |
Description |
|---|---|---|
Population size |
50,000 |
Bronze Age pop. size |
Population size |
5,000 |
Yamnaya pop. size |
Population size |
10,000 |
Western Hunter-Gatherer pop. size |
Population size |
10,000 |
Eastern Hunter-Gatherer pop. size |
Population size |
50,000 |
Neolithic Farmer pop. size |
Population size |
10,000 |
Caucasus Hunter-Gatherer pop. size |
Population size |
5,000 |
Northern European pop. size (ancestor of WHG and EHG) |
Population size |
5,000 |
West Asian pop. size (ancestor of Anatolian Farmers and CHG) |
Time (gen.) |
140 |
Time of Yamnaya and Neolithic Farmer admixture |
Time (gen.) |
180 |
Time of EHG and CHG admixture |
Time (gen.) |
200 |
Time of Anatolian Farmer and WHG admixture |
Time (gen.) |
600 |
Time of WHG and EHG divergence |
Time (gen.) |
800 |
Time of Anatolian Farmers and CHG divergence |
Time (gen.) |
1500 |
Time of Basal European split |
Growth rate (per gen.) |
6.7 |
Growth rate from Bronze Age to present day |
Time (gen.) |
0 |
Time of present day samples |
Time (gen.) |
135 |
Time of Bronze Age samples |
Time (gen.) |
160 |
Time of Yamnaya samples |
Time (gen.) |
180 |
Time of Neolithic Farmer samples |
Time (gen.) |
250 |
Time of Western Hunter-Gatherer samples |
Time (gen.) |
250 |
Time of Eastern Hunter-Gatherer samples |
Time (gen.) |
260 |
Time of Anatolian Farmer samples |
Time (gen.) |
300 |
Time of Caucasus Hunter-Gatherer samples |
Generation time (yrs.) |
29 |
Generation time |
Mutation rate |
1.25e-8 |
Per-base per-generation mutation rate |
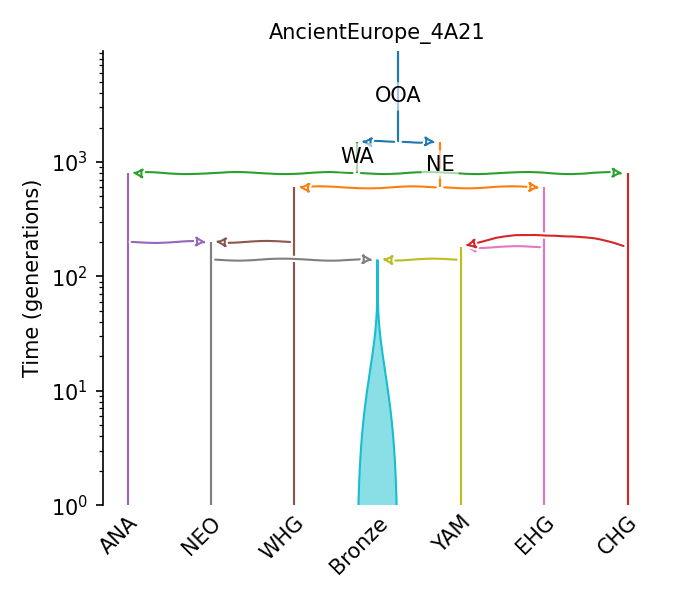
Annotations
ID |
Year |
Description |
|---|---|---|
2018 |
Ensembl Havana exon annotations on GRCh38 |
|
2018 |
Ensembl Havana CDS annotations on GRCh38 |
ensembl_havana_104_exons
Ensembl Havana exon annotations on GRCh38
Citations
Hunt et al, 2018. https://doi.org/10.1093/database/bay119
ensembl_havana_104_CDS
Ensembl Havana CDS annotations on GRCh38
Citations
Hunt et al, 2018. https://doi.org/10.1093/database/bay119
Distribution of Fitness Effects (DFEs)
ID |
Year |
Description |
|---|---|---|
2017 |
Deleterious Gamma DFE |
|
2017 |
Deleterious Gamma DFE |
|
2017 |
Deleterious Log-normal DFE |
|
2023 |
Deleterious Gamma DFE with additional lethals |
|
2024 |
Deleterious Gamma and Beneficial Exponential DFE |
|
2021 |
Deleterious Gamma DFE with fixed-s beneficials |
Gamma_K17
Deleterious Gamma DFE
Deleterious, gamma-distributed DFE estimated using ‘Fit∂a∂i’ from the nonsynonymous SFS in exons from a dataset of European humans by Kim et al. (2017).
Citations
Kim et al., 2017. https://doi.org/10.1534/genetics.116.197145
DFE parameters
Proportion of mutations |
Distribution type |
Parameters |
Dominance |
|---|---|---|---|
30.0% |
Fixed s |
s = 0.000 |
h = 0.500 |
70.0% |
Gamma |
mean = -0.013, shape = 0.186 |
h = 0.500 |
Gamma_H17
Deleterious Gamma DFE
Deleterious, gamma-distributed DFE estimated from the SFS of YRI samples in the 1000 genomes project by Huber et al. (2017). DFE parameters are from the “full” model in Table S2, in which all data (none of the listed filters) were used.
Citations
Huber et al., 2017. https://doi.org/10.1073/pnas.1619508114
DFE parameters
Proportion of mutations |
Distribution type |
Parameters |
Dominance |
|---|---|---|---|
30.0% |
Fixed s |
s = 0.000 |
h = 0.500 |
70.0% |
Gamma |
mean = -0.028, shape = 0.190 |
h = 0.500 |
LogNormal_H17
Deleterious Log-normal DFE
Deleterious, log-normal-distributed DFE estimated from the SFS of YRI samples in the 1000 genomes project by Huber et al. (2017). Parameters as shown for the “full” model in Table S3.
Citations
Huber et al., 2017. https://doi.org/10.1073/pnas.1619508114
DFE parameters
Proportion of mutations |
Distribution type |
Parameters |
Dominance |
|---|---|---|---|
30.0% |
Fixed s |
s = 0.000 |
h = 0.500 |
70.0% |
Negative LogNormal |
meanlog = -6.677, sdlog = 4.580 |
h = 0.500 |
Mixed_K23
Deleterious Gamma DFE with additional lethals
The DFE estimated from human data recommended in Kyriazis et al. (2023), for general use. This model is similar to the Kim et al. (2017) DFE based on human genetic data, modified to include the dominance distribution from Henn et al. (2016). The model is also augmented with an additional proportion of 0.3% of recessive lethals, based on the analysis of Wade et al. (2023).
Citations
Kyriazis et al., 2023. https://doi.org/10.1086/726736
DFE parameters
Proportion of mutations |
Distribution type |
Parameters |
Dominance |
|---|---|---|---|
30.2% |
Fixed s |
s = 0.000 |
h = 0.500 |
69.6% |
Gamma |
mean = -0.013, shape = 0.186 |
h = 0.450 on [0, 0.001); 0.200 on [0.001, 0.010); 0.050 on [0.010, 0.100); 0.000 on [0.100, Inf) |
0.2% |
Fixed s |
s = -1.000 |
h = 0.000 |
PosNeg_R24
Deleterious Gamma and Beneficial Exponential DFE
The best-fitting DFE simulated by Rodrigues et al (2024), from among 57 simulated scenarios with varying amounts of positive and negative selection. Fit was based on similarity of diversity and divergence across the great ape clade in simulations; the shape of the DFE was not inferred, only the proportion of positive and negative mutations; the shape of the deleterious portion of the DFE was obtained from Castellano et al (2019), https://doi.org/10.1534/genetics.119.302494.
Citations
Rodrigues et al., 2024. https://doi.org/10.1093/genetics/iyae006
Castellano et al., 2019. https://doi.org/10.1534/genetics.119.302494
DFE parameters
Proportion of mutations |
Distribution type |
Parameters |
Dominance |
|---|---|---|---|
40.0% |
Fixed s |
s = 0.000 |
h = 0.500 |
0.0% |
Gamma |
mean = -0.030, shape = 0.160 |
h = 0.500 |
60.0% |
Exponential |
mean = 0.010 |
h = 0.500 |
GammaPos_Z21
Deleterious Gamma DFE with fixed-s beneficials
The DFE estimated from human-chimp data estimated in Zhen et al (2021, https://dx.doi.org/10.1101/gr.256636.119). This uses the demographic model and deleterious-only DFE from Huber et al (2017), and then the number of nonsynonymous differences to chimpanzee to estimate a proportion of nonsynonmyous differences and (single) selection coefficient. So, this is the “Gamma_H17” DFE, with some proportion of positive selection with fixed s.
Citations
Zhen et al., 2021. https://dx.doi.org/10.1101/gr.256636.119
DFE parameters
Proportion of mutations |
Distribution type |
Parameters |
Dominance |
|---|---|---|---|
30.0% |
Fixed s |
s = 0.000 |
h = 0.500 |
68.9% |
Gamma |
mean = -0.028, shape = 0.190 |
h = 0.500 |
1.1% |
Fixed s |
s = 0.000 |
h = 0.500 |
Mus musculus
- ID:
MusMus
- Name:
Mus musculus
- Common name:
Mouse
- Generation time:
0.75 (Phifer-Rixey, et al., 2020)
- Ploidy:
2
- Population size:
500000 (Phifer-Rixey, et al., 2012; Booker and Keightley, 2018; Fujiwara et al., 2022)
Genome
- Genome assembly name:
GRCm39
ID |
Ploidy |
Length |
Recombination rate |
Mutation rate |
|---|---|---|---|---|
1 |
2 |
195154279 |
5e-09 |
5.4e-09 |
2 |
2 |
181755017 |
5.7e-09 |
5.4e-09 |
3 |
2 |
159745316 |
5.2e-09 |
5.4e-09 |
4 |
2 |
156860686 |
5.6e-09 |
5.4e-09 |
5 |
2 |
151758149 |
5.9e-09 |
5.4e-09 |
6 |
2 |
149588044 |
5.3e-09 |
5.4e-09 |
7 |
2 |
144995196 |
5.8e-09 |
5.4e-09 |
8 |
2 |
130127694 |
5.8e-09 |
5.4e-09 |
9 |
2 |
124359700 |
6.1e-09 |
5.4e-09 |
10 |
2 |
130530862 |
6.1e-09 |
5.4e-09 |
11 |
2 |
121973369 |
7e-09 |
5.4e-09 |
12 |
2 |
120092757 |
5.3e-09 |
5.4e-09 |
13 |
2 |
120883175 |
5.6e-09 |
5.4e-09 |
14 |
2 |
125139656 |
5.3e-09 |
5.4e-09 |
15 |
2 |
104073951 |
5.6e-09 |
5.4e-09 |
16 |
2 |
98008968 |
5.9e-09 |
5.4e-09 |
17 |
2 |
95294699 |
6.5e-09 |
5.4e-09 |
18 |
2 |
90720763 |
6.6e-09 |
5.4e-09 |
19 |
2 |
61420004 |
9.4e-09 |
5.4e-09 |
X |
2 |
169476592 |
4.8e-09 |
5.4e-09 |
Y |
1 |
91455967 |
0 |
5.4e-09 |
MT |
1 |
16299 |
0 |
2.775e-08 |
Mutation and recombination rates are in units of per bp and per generation.
Demographic Models
ID |
Description |
|---|---|
M. musculus domesticus piecewise constant size |
|
M. musculus musculus piecewise constant size |
|
M. musculus musculus piecewise constant size |
M. musculus domesticus piecewise constant size
This model comes from MSMC using four randomly sampled individuals (DEU01,DEU03,DEU04,DEU06) from a German population. The model is estimated with 57 time periods. Data were provided directly by the first and corresponding authors of the paper, Kazumichi Fujiwara and Naoki Osada, respectively. A graphical depiction of the model can be found in Figure 3 of the paper.
Details
- ID:
DomesticusEurope_1F22
- Description:
M. musculus domesticus piecewise constant size
- Num populations:
1
Populations
Index |
ID |
Sampling time |
Description |
|---|---|---|---|
0 |
M_musculus_domesticus |
0 |
Mus musculus domesticus German population |
Citations
Fujiwara et al., 2022. https://doi.org/10.1093/gbe/evac068
Demographic Model parameters
Parameter Type (units) |
Value |
Description |
|---|---|---|
Population size |
133912 |
Ancestral population size |
Population size |
133912 |
Pop. size during 1st time interval |
Population size |
133912 |
Pop. size during 2nd time interval |
Population size |
133912 |
Pop. size during 3rd time interval |
Population size |
98811 |
Pop. size during 4th time interval |
Population size |
98811 |
Pop. size during 5th time interval |
Population size |
131050 |
Pop. size during 6th time interval |
Population size |
173594 |
Pop. size during 7th time interval |
Population size |
227037 |
Pop. size during 8th time interval |
Population size |
279833 |
Pop. size during 9th time interval |
Population size |
316861 |
Pop. size during 10th time interval |
Population size |
327217 |
Pop. size during 11th time interval |
Population size |
309961 |
Pop. size during 12th time interval |
Population size |
271935 |
Pop. size during 13th time interval |
Population size |
222951 |
Pop. size during 14th time interval |
Population size |
173264 |
Pop. size during 15th time interval |
Population size |
131392 |
Pop. size during 16th time interval |
Population size |
101471 |
Pop. size during 17th time interval |
Population size |
82953 |
Pop. size during 18th time interval |
Population size |
73097 |
Pop. size during 19th time interval |
Population size |
69317 |
Pop. size during 20th time interval |
Population size |
69939 |
Pop. size during 21th time interval |
Population size |
74185 |
Pop. size during 22th time interval |
Population size |
81892 |
Pop. size during 23th time interval |
Population size |
93046 |
Pop. size during 24th time interval |
Population size |
107067 |
Pop. size during 25th time interval |
Population size |
121751 |
Pop. size during 26th time interval |
Population size |
132063 |
Pop. size during 27th time interval |
Population size |
131016 |
Pop. size during 28th time interval |
Population size |
115426 |
Pop. size during 29th time interval |
Population size |
90926 |
Pop. size during 30th time interval |
Population size |
67337 |
Pop. size during 31th time interval |
Population size |
50557 |
Pop. size during 32th time interval |
Population size |
41195 |
Pop. size during 33th time interval |
Population size |
36886 |
Pop. size during 34th time interval |
Population size |
34163 |
Pop. size during 35th time interval |
Population size |
29931 |
Pop. size during 36th time interval |
Population size |
23419 |
Pop. size during 37th time interval |
Population size |
16490 |
Pop. size during 38th time interval |
Population size |
11240 |
Pop. size during 39th time interval |
Population size |
8332 |
Pop. size during 40th time interval |
Population size |
7480 |
Pop. size during 41th time interval |
Population size |
8463 |
Pop. size during 42th time interval |
Population size |
11758 |
Pop. size during 43th time interval |
Population size |
18939 |
Pop. size during 44th time interval |
Population size |
33028 |
Pop. size during 45th time interval |
Population size |
58488 |
Pop. size during 46th time interval |
Population size |
97250 |
Pop. size during 47th time interval |
Population size |
136620 |
Pop. size during 48th time interval |
Population size |
159142 |
Pop. size during 49th time interval |
Population size |
147212 |
Pop. size during 50th time interval |
Population size |
115399 |
Pop. size during 51th time interval |
Population size |
111242 |
Pop. size during 52th time interval |
Population size |
145603 |
Pop. size during 53th time interval |
Population size |
90428 |
Pop. size during 54th time interval |
Population size |
3844 |
Pop. size during 55th time interval |
Population size |
2040 |
Pop. size during 56th time interval |
Time (yrs.) |
1915544 |
Begining of 1st time interval |
Time (yrs.) |
1654653 |
Begining of 2nd time interval |
Time (yrs.) |
1429281 |
Begining of 3rd time interval |
Time (yrs.) |
1234595 |
Begining of 4th time interval |
Time (yrs.) |
1066418 |
Begining of 5th time interval |
Time (yrs.) |
921140 |
Begining of 6th time interval |
Time (yrs.) |
795646 |
Begining of 7th time interval |
Time (yrs.) |
687237 |
Begining of 8th time interval |
Time (yrs.) |
593589 |
Begining of 9th time interval |
Time (yrs.) |
512693 |
Begining of 10th time interval |
Time (yrs.) |
442812 |
Begining of 11th time interval |
Time (yrs.) |
382446 |
Begining of 12th time interval |
Time (yrs.) |
330300 |
Begining of 13th time interval |
Time (yrs.) |
285254 |
Begining of 14th time interval |
Time (yrs.) |
246340 |
Begining of 15th time interval |
Time (yrs.) |
212726 |
Begining of 16th time interval |
Time (yrs.) |
183689 |
Begining of 17th time interval |
Time (yrs.) |
158606 |
Begining of 18th time interval |
Time (yrs.) |
136938 |
Begining of 19th time interval |
Time (yrs.) |
118221 |
Begining of 20th time interval |
Time (yrs.) |
102052 |
Begining of 21th time interval |
Time (yrs.) |
88084 |
Begining of 22th time interval |
Time (yrs.) |
76019 |
Begining of 23th time interval |
Time (yrs.) |
65596 |
Begining of 24th time interval |
Time (yrs.) |
56592 |
Begining of 25th time interval |
Time (yrs.) |
48815 |
Begining of 26th time interval |
Time (yrs.) |
42096 |
Begining of 27th time interval |
Time (yrs.) |
36292 |
Begining of 28th time interval |
Time (yrs.) |
31279 |
Begining of 29th time interval |
Time (yrs.) |
26948 |
Begining of 30th time interval |
Time (yrs.) |
23207 |
Begining of 31th time interval |
Time (yrs.) |
19975 |
Begining of 32th time interval |
Time (yrs.) |
17183 |
Begining of 33th time interval |
Time (yrs.) |
14772 |
Begining of 34th time interval |
Time (yrs.) |
12688 |
Begining of 35th time interval |
Time (yrs.) |
10889 |
Begining of 36th time interval |
Time (yrs.) |
9334 |
Begining of 37th time interval |
Time (yrs.) |
7991 |
Begining of 38th time interval |
Time (yrs.) |
6831 |
Begining of 39th time interval |
Time (yrs.) |
5829 |
Begining of 40th time interval |
Time (yrs.) |
4964 |
Begining of 41th time interval |
Time (yrs.) |
4216 |
Begining of 42th time interval |
Time (yrs.) |
3570 |
Begining of 43th time interval |
Time (yrs.) |
3012 |
Begining of 44th time interval |
Time (yrs.) |
2530 |
Begining of 45th time interval |
Time (yrs.) |
2114 |
Begining of 46th time interval |
Time (yrs.) |
1754 |
Begining of 47th time interval |
Time (yrs.) |
1443 |
Begining of 48th time interval |
Time (yrs.) |
1175 |
Begining of 49th time interval |
Time (yrs.) |
943 |
Begining of 50th time interval |
Time (yrs.) |
743 |
Begining of 51th time interval |
Time (yrs.) |
570 |
Begining of 52th time interval |
Time (yrs.) |
420 |
Begining of 53th time interval |
Time (yrs.) |
291 |
Begining of 54th time interval |
Time (yrs.) |
180 |
Begining of 55th time interval |
Time (yrs.) |
83 |
Begining of 56th time interval |
Time (yrs.) |
0 |
Begining of 57th time interval |
Generation time (yrs.) |
1 |
Average generation interval |
Mutation rate |
5.7e-9 |
Per-base per-generation mutation rate |
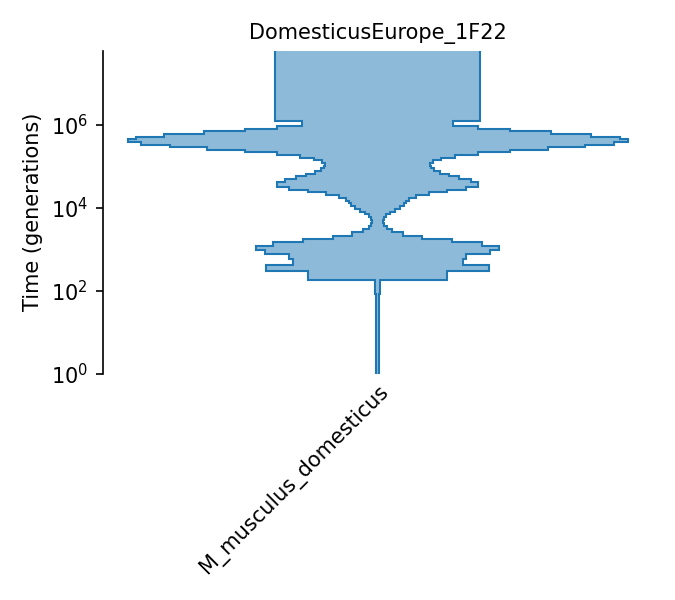
M. musculus musculus piecewise constant size
This model comes from MSMC using four randomly sampled individuals (KOR01,KOR02,KOR03,KOR05) from a Korean population. The model is estimated with 57 time periods. Data were provided directly by the first and corresponding authors of the paper, Kazumichi Fujiwara and Naoki Osada, respectively. A graphical depiction of the model can be found in Figure 3 of the paper.
Details
- ID:
MusculusKorea_1F22
- Description:
M. musculus musculus piecewise constant size
- Num populations:
1
Populations
Index |
ID |
Sampling time |
Description |
|---|---|---|---|
0 |
M_musculus_musculus |
0 |
Mus musculus musculus Korean population |
Citations
Fujiwara et al., 2022. https://doi.org/10.1093/gbe/evac068
Demographic Model parameters
Parameter Type (units) |
Value |
Description |
|---|---|---|
Population size |
152757 |
Ancestral population size |
Population size |
152757 |
Pop. size during 1st time interval |
Population size |
152757 |
Pop. size during 2nd time interval |
Population size |
152757 |
Pop. size during 3rd time interval |
Population size |
407105 |
Pop. size during 4th time interval |
Population size |
407105 |
Pop. size during 5th time interval |
Population size |
400867 |
Pop. size during 6th time interval |
Population size |
359368 |
Pop. size during 7th time interval |
Population size |
302950 |
Pop. size during 8th time interval |
Population size |
245823 |
Pop. size during 9thtime interval |
Population size |
194969 |
Pop. size during 10th time interval |
Population size |
151909 |
Pop. size during 11th time interval |
Population size |
116547 |
Pop. size during 12th time interval |
Population size |
88494 |
Pop. size during 13th time interval |
Population size |
67725 |
Pop. size during 14th time interval |
Population size |
54304 |
Pop. size during 15th time interval |
Population size |
47001 |
Pop. size during 16th time interval |
Population size |
43933 |
Pop. size during 17th time interval |
Population size |
43467 |
Pop. size during 18th time interval |
Population size |
43874 |
Pop. size during 19th time interval |
Population size |
42857 |
Pop. size during 20th time interval |
Population size |
38441 |
Pop. size during 21th time interval |
Population size |
30806 |
Pop. size during 22th time interval |
Population size |
22556 |
Pop. size during 23th time interval |
Population size |
16339 |
Pop. size during 24th time interval |
Population size |
13023 |
Pop. size during 25th time interval |
Population size |
12259 |
Pop. size during 26th time interval |
Population size |
13588 |
Pop. size during 27th time interval |
Population size |
16747 |
Pop. size during 28th time interval |
Population size |
21219 |
Pop. size during 29th time interval |
Population size |
25399 |
Pop. size during 30th time interval |
Population size |
26648 |
Pop. size during 31th time interval |
Population size |
23546 |
Pop. size during 32th time interval |
Population size |
17741 |
Pop. size during 33th time interval |
Population size |
12072 |
Pop. size during 34th time interval |
Population size |
7990 |
Pop. size during 35th time interval |
Population size |
5506 |
Pop. size during 36th time interval |
Population size |
4177 |
Pop. size during 37th time interval |
Population size |
3643 |
Pop. size during 38th time interval |
Population size |
3751 |
Pop. size during 39th time interval |
Population size |
4605 |
Pop. size during 40th time interval |
Population size |
6695 |
Pop. size during 41th time interval |
Population size |
11222 |
Pop. size during 42th time interval |
Population size |
20382 |
Pop. size during 43th time interval |
Population size |
36220 |
Pop. size during 44th time interval |
Population size |
55959 |
Pop. size during 45th time interval |
Population size |
68111 |
Pop. size during 46th time interval |
Population size |
61935 |
Pop. size during 47th time interval |
Population size |
42715 |
Pop. size during 48th time interval |
Population size |
25527 |
Pop. size during 49th time interval |
Population size |
16254 |
Pop. size during 50th time interval |
Population size |
12104 |
Pop. size during 51th time interval |
Population size |
9960 |
Pop. size during 52th time interval |
Population size |
9029 |
Pop. size during 53th time interval |
Population size |
8035 |
Pop. size during 54th time interval |
Population size |
8931 |
Pop. size during 55th time interval |
Population size |
179912 |
Pop. size during 56th time interval |
Time (yrs.) |
807711 |
Begining of 1st time interval |
Time (yrs.) |
697702 |
Begining of 2nd time interval |
Time (yrs.) |
602670 |
Begining of 3rd time interval |
Time (yrs.) |
520579 |
Begining of 4th time interval |
Time (yrs.) |
449667 |
Begining of 5th time interval |
Time (yrs.) |
388409 |
Begining of 6th time interval |
Time (yrs.) |
335491 |
Begining of 7th time interval |
Time (yrs.) |
289781 |
Begining of 8th time interval |
Time (yrs.) |
250293 |
Begining of 9th time interval |
Time (yrs.) |
216182 |
Begining of 10th time interval |
Time (yrs.) |
186716 |
Begining of 11th time interval |
Time (yrs.) |
161262 |
Begining of 12th time interval |
Time (yrs.) |
139274 |
Begining of 13th time interval |
Time (yrs.) |
120280 |
Begining of 14th time interval |
Time (yrs.) |
103872 |
Begining of 15th time interval |
Time (yrs.) |
89698 |
Begining of 16th time interval |
Time (yrs.) |
77455 |
Begining of 17th time interval |
Time (yrs.) |
66878 |
Begining of 18th time interval |
Time (yrs.) |
57741 |
Begining of 19th time interval |
Time (yrs.) |
49849 |
Begining of 20th time interval |
Time (yrs.) |
43031 |
Begining of 21th time interval |
Time (yrs.) |
37142 |
Begining of 22th time interval |
Time (yrs.) |
32054 |
Begining of 23th time interval |
Time (yrs.) |
27659 |
Begining of 24th time interval |
Time (yrs.) |
23863 |
Begining of 25th time interval |
Time (yrs.) |
20583 |
Begining of 26th time interval |
Time (yrs.) |
17750 |
Begining of 27th time interval |
Time (yrs.) |
15303 |
Begining of 28th time interval |
Time (yrs.) |
13189 |
Begining of 29th time interval |
Time (yrs.) |
11363 |
Begining of 30th time interval |
Time (yrs.) |
9785 |
Begining of 31th time interval |
Time (yrs.) |
8423 |
Begining of 32th time interval |
Time (yrs.) |
7246 |
Begining of 33th time interval |
Time (yrs.) |
6229 |
Begining of 34th time interval |
Time (yrs.) |
5350 |
Begining of 35th time interval |
Time (yrs.) |
4591 |
Begining of 36th time interval |
Time (yrs.) |
3936 |
Begining of 37th time interval |
Time (yrs.) |
3370 |
Begining of 38th time interval |
Time (yrs.) |
2881 |
Begining of 39th time interval |
Time (yrs.) |
2458 |
Begining of 40th time interval |
Time (yrs.) |
2093 |
Begining of 41th time interval |
Time (yrs.) |
1778 |
Begining of 42th time interval |
Time (yrs.) |
1505 |
Begining of 43th time interval |
Time (yrs.) |
1270 |
Begining of 44th time interval |
Time (yrs.) |
1067 |
Begining of 45th time interval |
Time (yrs.) |
891 |
Begining of 46th time interval |
Time (yrs.) |
740 |
Begining of 47th time interval |
Time (yrs.) |
609 |
Begining of 48th time interval |
Time (yrs.) |
495 |
Begining of 49th time interval |
Time (yrs.) |
398 |
Begining of 50th time interval |
Time (yrs.) |
313 |
Begining of 51th time interval |
Time (yrs.) |
240 |
Begining of 52th time interval |
Time (yrs.) |
177 |
Begining of 53th time interval |
Time (yrs.) |
123 |
Begining of 54th time interval |
Time (yrs.) |
76 |
Begining of 55th time interval |
Time (yrs.) |
35 |
Begining of 56th time interval |
Time (yrs.) |
0 |
Begining of 57th time interval |
Generation time (yrs.) |
1 |
Average generation interval |
Mutation rate |
5.7e-9 |
Per-base per-generation mutation rate |
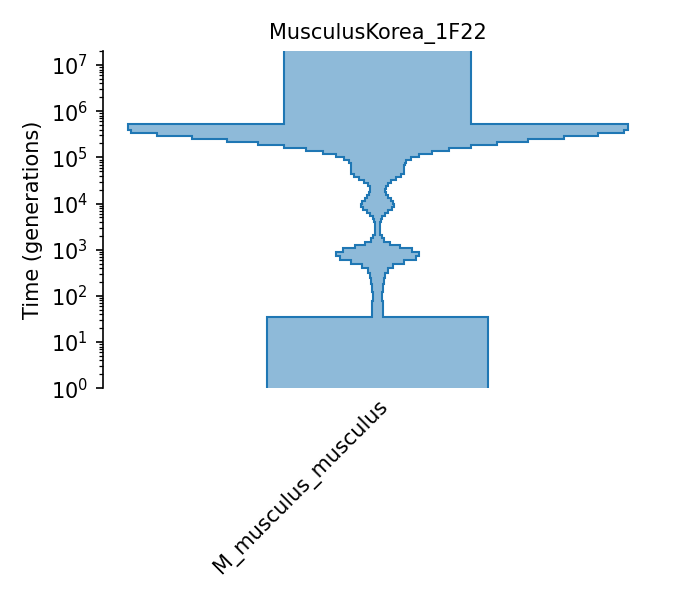
M. musculus musculus piecewise constant size
This model comes from MSMC using two randomly sampled individuals (IND03,IND04) from a Indian population. The model is estimated with 57 time periods. Data were provided directly by the first and corresponding authors of the paper, Kazumichi Fujiwara and Naoki Osada, respectively. A graphical depiction of the model can be found in Figure 3 of the paper.
Details
- ID:
CastaneusIndia_1F22
- Description:
M. musculus musculus piecewise constant size
- Num populations:
1
Populations
Index |
ID |
Sampling time |
Description |
|---|---|---|---|
0 |
M_musculus_castaneus |
0 |
Mus musculus castaneus Indian population |
Citations
Fujiwara et al., 2022. https://doi.org/10.1093/gbe/evac068
Demographic Model parameters
Parameter Type (units) |
Value |
Description |
|---|---|---|
Population size |
344802 |
Ancestral population size |
Population size |
344802 |
Pop. size during 1st time interval |
Population size |
344802 |
Pop. size during 2nd time interval |
Population size |
344802 |
Pop. size during 3rd time interval |
Population size |
463464 |
Pop. size during 4th time interval |
Population size |
463464 |
Pop. size during 5th time interval |
Population size |
360433 |
Pop. size during 6th time interval |
Population size |
275733 |
Pop. size during 7th time interval |
Population size |
217017 |
Pop. size during 8th time interval |
Population size |
182054 |
Pop. size during 9th time interval |
Population size |
163295 |
Pop. size during 10th time interval |
Population size |
155027 |
Pop. size during 11th time interval |
Population size |
154098 |
Pop. size during 12th time interval |
Population size |
159139 |
Pop. size during 13th time interval |
Population size |
169657 |
Pop. size during 14th time interval |
Population size |
185260 |
Pop. size during 15th time interval |
Population size |
205098 |
Pop. size during 16th time interval |
Population size |
227605 |
Pop. size during 17th time interval |
Population size |
250544 |
Pop. size during 18th time interval |
Population size |
271326 |
Pop. size during 19th time interval |
Population size |
287572 |
Pop. size during 20th time interval |
Population size |
297772 |
Pop. size during 21th time interval |
Population size |
301783 |
Pop. size during 22th time interval |
Population size |
300840 |
Pop. size during 23th time interval |
Population size |
297138 |
Pop. size during 24th time interval |
Population size |
293233 |
Pop. size during 25th time interval |
Population size |
291560 |
Pop. size during 26th time interval |
Population size |
294117 |
Pop. size during 27th time interval |
Population size |
302369 |
Pop. size during 28th time interval |
Population size |
317235 |
Pop. size during 29th time interval |
Population size |
338818 |
Pop. size during 30th time interval |
Population size |
365787 |
Pop. size during 31th time interval |
Population size |
394606 |
Pop. size during 32th time interval |
Population size |
418882 |
Pop. size during 33th time interval |
Population size |
429975 |
Pop. size during 34th time interval |
Population size |
420389 |
Pop. size during 35th time interval |
Population size |
388298 |
Pop. size during 36th time interval |
Population size |
338426 |
Pop. size during 37th time interval |
Population size |
279816 |
Pop. size during 38th time interval |
Population size |
222464 |
Pop. size during 39th time interval |
Population size |
173419 |
Pop. size during 40th time interval |
Population size |
134861 |
Pop. size during 41th time interval |
Population size |
105533 |
Pop. size during 42th time interval |
Population size |
83216 |
Pop. size during 43th time interval |
Population size |
66260 |
Pop. size during 44th time interval |
Population size |
53747 |
Pop. size during 45th time interval |
Population size |
45372 |
Pop. size during 46th time interval |
Population size |
41297 |
Pop. size during 47th time interval |
Population size |
41845 |
Pop. size during 48th time interval |
Population size |
47736 |
Pop. size during 49th time interval |
Population size |
60911 |
Pop. size during 50th time interval |
Population size |
86633 |
Pop. size during 51th time interval |
Population size |
141377 |
Pop. size during 52th time interval |
Population size |
291323 |
Pop. size during 53th time interval |
Population size |
938111 |
Pop. size during 54th time interval |
Population size |
5064712 |
Pop. size during 55th time interval |
Population size |
64853 |
Pop. size during 56th time interval |
Time (yrs.) |
5585000 |
Begining of 1st time interval |
Time (yrs.) |
4955842 |
Begining of 2nd time interval |
Time (yrs.) |
4397456 |
Begining of 3rd time interval |
Time (yrs.) |
3901912 |
Begining of 4th time interval |
Time (yrs.) |
3462105 |
Begining of 5th time interval |
Time (yrs.) |
3071789 |
Begining of 6th time interval |
Time (yrs.) |
2725404 |
Begining of 7th time interval |
Time (yrs.) |
2417965 |
Begining of 8th time interval |
Time (yrs.) |
2145140 |
Begining of 9th time interval |
Time (yrs.) |
1903000 |
Begining of 10th time interval |
Time (yrs.) |
1688102 |
Begining of 11th time interval |
Time (yrs.) |
1497384 |
Begining of 12th time interval |
Time (yrs.) |
1328123 |
Begining of 13th time interval |
Time (yrs.) |
1177907 |
Begining of 14th time interval |
Time (yrs.) |
1044593 |
Begining of 15th time interval |
Time (yrs.) |
926277 |
Begining of 16th time interval |
Time (yrs.) |
821274 |
Begining of 17th time interval |
Time (yrs.) |
728084 |
Begining of 18th time interval |
Time (yrs.) |
645379 |
Begining of 19th time interval |
Time (yrs.) |
571979 |
Begining of 20th time interval |
Time (yrs.) |
506839 |
Begining of 21th time interval |
Time (yrs.) |
449026 |
Begining of 22th time interval |
Time (yrs.) |
397719 |
Begining of 23th time interval |
Time (yrs.) |
352184 |
Begining of 24th time interval |
Time (yrs.) |
311772 |
Begining of 25th time interval |
Time (yrs.) |
275907 |
Begining of 26th time interval |
Time (yrs.) |
244079 |
Begining of 27th time interval |
Time (yrs.) |
215830 |
Begining of 28th time interval |
Time (yrs.) |
190760 |
Begining of 29th time interval |
Time (yrs.) |
168510 |
Begining of 30th time interval |
Time (yrs.) |
148764 |
Begining of 31th time interval |
Time (yrs.) |
131239 |
Begining of 32th time interval |
Time (yrs.) |
115687 |
Begining of 33th time interval |
Time (yrs.) |
101884 |
Begining of 34th time interval |
Time (yrs.) |
89634 |
Begining of 35th time interval |
Time (yrs.) |
78762 |
Begining of 36th time interval |
Time (yrs.) |
69114 |
Begining of 37th time interval |
Time (yrs.) |
60551 |
Begining of 38th time interval |
Time (yrs.) |
52951 |
Begining of 39th time interval |
Time (yrs.) |
46207 |
Begining of 40th time interval |
Time (yrs.) |
40221 |
Begining of 41th time interval |
Time (yrs.) |
34909 |
Begining of 42th time interval |
Time (yrs.) |
30195 |
Begining of 43th time interval |
Time (yrs.) |
26011 |
Begining of 44th time interval |
Time (yrs.) |
22297 |
Begining of 45th time interval |
Time (yrs.) |
19002 |
Begining of 46th time interval |
Time (yrs.) |
16077 |
Begining of 47th time interval |
Time (yrs.) |
13481 |
Begining of 48th time interval |
Time (yrs.) |
11178 |
Begining of 49th time interval |
Time (yrs.) |
9133 |
Begining of 50th time interval |
Time (yrs.) |
7319 |
Begining of 51th time interval |
Time (yrs.) |
5709 |
Begining of 52th time interval |
Time (yrs.) |
4279 |
Begining of 53th time interval |
Time (yrs.) |
3011 |
Begining of 54th time interval |
Time (yrs.) |
1886 |
Begining of 55th time interval |
Time (yrs.) |
887 |
Begining of 56th time interval |
Time (yrs.) |
0 |
Begining of 57th time interval |
Generation time (yrs.) |
1 |
Average generation interval |
Mutation rate |
5.7e-9 |
Per-base per-generation mutation rate |
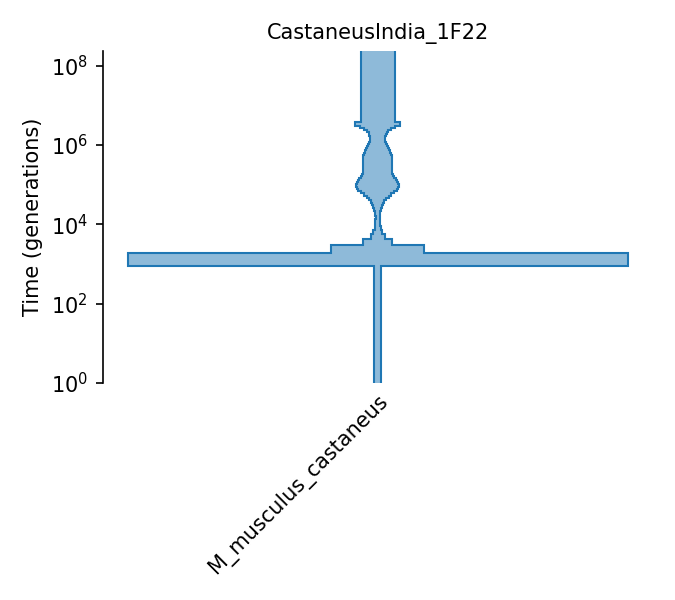
Distribution of Fitness Effects (DFEs)
ID |
Year |
Description |
|---|---|---|
2021 |
Deleterious Gamma DFE CDS |
Gamma_B21
Deleterious Gamma DFE CDS
A gamma-distributed DFE for deleterious mutations estimated from the SFS of Mus musculus castaneous exons by Booker et al. (2021), using polyDFE v2 (Tataru and Bataillon 2019).
Citations
Booker et al., 2021. https://doi.org/10.1101/2021.06.10.447924
DFE parameters
Proportion of mutations |
Distribution type |
Parameters |
Dominance |
|---|---|---|---|
33.4% |
Fixed s |
s = 0.000 |
h = 0.500 |
66.6% |
Gamma |
mean = -0.060, shape = 0.186 |
h = 0.500 |
Oryza sativa
- ID:
OrySat
- Name:
Oryza sativa
- Common name:
Asian rice
- Generation time:
- Ploidy:
2
- Population size:
46875
Genome
- Genome assembly name:
None
ID |
Ploidy |
Length |
Recombination rate |
Mutation rate |
|---|---|---|---|---|
1 |
2 |
43270923 |
8.97e-10 |
3.2e-09 |
Mt |
1 |
490520 |
0 |
3.2e-09 |
Pt |
1 |
134525 |
0 |
3.2e-09 |
2 |
2 |
35937250 |
8.97e-10 |
3.2e-09 |
3 |
2 |
36413819 |
8.97e-10 |
3.2e-09 |
4 |
2 |
35502694 |
8.97e-10 |
3.2e-09 |
5 |
2 |
29958434 |
8.97e-10 |
3.2e-09 |
6 |
2 |
31248787 |
8.97e-10 |
3.2e-09 |
7 |
2 |
29697621 |
8.97e-10 |
3.2e-09 |
8 |
2 |
28443022 |
8.97e-10 |
3.2e-09 |
9 |
2 |
23012720 |
8.97e-10 |
3.2e-09 |
10 |
2 |
23207287 |
8.97e-10 |
3.2e-09 |
11 |
2 |
29021106 |
8.97e-10 |
3.2e-09 |
12 |
2 |
27531856 |
8.97e-10 |
3.2e-09 |
Mutation and recombination rates are in units of per bp and per generation.
Demographic Models
ID |
Description |
|---|---|
Bottleneck + migration model for the origin of domesticated rice varieties |
Bottleneck + migration model for the origin of domesticated rice varieties
The bottleneck + migration model of domesticated rice varieties (indica and tropical japonica) from Caicedo et al. (2007). Parameters were inferred from the site frequency spectrum (SFS), with parameter values taken from Table 2.
Details
- ID:
BottleneckMigration_3C07
- Description:
Bottleneck + migration model for the origin of domesticated rice varieties
- Num populations:
3
Populations
Index |
ID |
Sampling time |
Description |
|---|---|---|---|
0 |
RUF |
0 |
Oryza rufipogon (wild rice) |
1 |
IND |
0 |
Oryza sativa indica |
2 |
TRJ |
0 |
Tropical Oryza sativa japonica |
Citations
Caicedo et al., 2007. https://doi.org/10.1371/journal.pgen.0030163
Demographic Model parameters
Parameter Type (units) |
Value |
Description |
|---|---|---|
Population size |
150,000 |
Ancestral pop. size |
Population size |
150,000 |
RUF pop. size |
Population size |
40,500 |
IND pop. size |
Population size |
18,000 |
TRJ pop. size |
Population size |
825 |
IND pop. size after origin |
Population size |
825 |
TRJ pop. size after origin |
Migration rate (x10^-5) |
2.33 |
RUF-IND migration rate (per gen.) |
Migration rate (x10^-5) |
2.33 |
TRJ-IND migration rate (per gen.) |
Migration rate (x10^-5) |
2.33 |
TRJ-RUF migration rate (per gen.) |
Epoch Time (gen.) |
12,000 |
Time of origin and beginning of domestication bottleneck of IND and TRJ |
Epoch Time (gen.) |
9,000 |
Time of partial recovery from bottleneck of IND and TRJ |
Generation time (yrs.) |
1 |
Generation time |
Mutation rate |
9.03e-9 |
Per-base per-generation mutation rate |
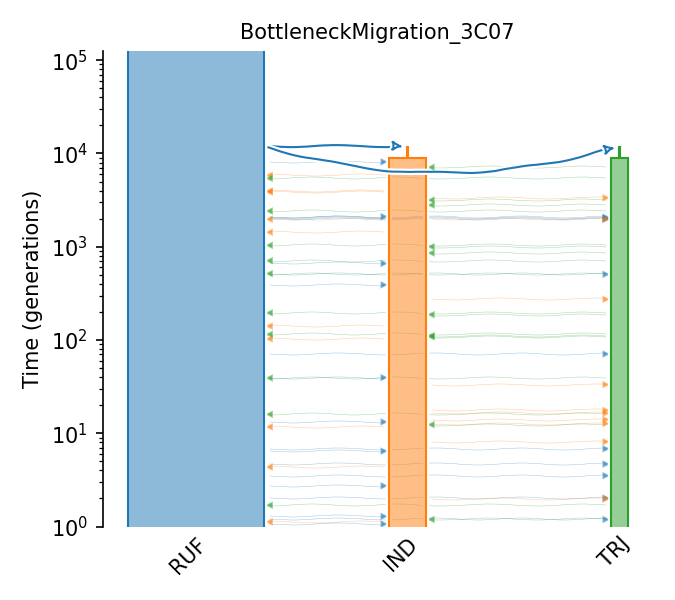
Pan troglodytes
- ID:
PanTro
- Name:
Pan troglodytes
- Common name:
Chimpanzee
- Generation time:
24.6 (Langergraber et al., 2012)
- Ploidy:
2
- Population size:
16781 (Stevison et al., 2015)
Genome
- Genome assembly name:
Pan_tro_3.0
ID |
Ploidy |
Length |
Recombination rate |
Mutation rate |
|---|---|---|---|---|
1 |
2 |
228573443 |
1.2e-08 |
1.6e-08 |
2A |
2 |
111504155 |
1.2e-08 |
1.6e-08 |
2B |
2 |
133216015 |
1.2e-08 |
1.6e-08 |
3 |
2 |
202621043 |
1.2e-08 |
1.6e-08 |
4 |
2 |
194502333 |
1.2e-08 |
1.6e-08 |
5 |
2 |
181907262 |
1.2e-08 |
1.6e-08 |
6 |
2 |
175400573 |
1.2e-08 |
1.6e-08 |
7 |
2 |
166211670 |
1.2e-08 |
1.6e-08 |
8 |
2 |
147911612 |
1.2e-08 |
1.6e-08 |
9 |
2 |
116767853 |
1.2e-08 |
1.6e-08 |
10 |
2 |
135926727 |
1.2e-08 |
1.6e-08 |
11 |
2 |
135753878 |
1.2e-08 |
1.6e-08 |
12 |
2 |
137163284 |
1.2e-08 |
1.6e-08 |
13 |
2 |
100452976 |
1.2e-08 |
1.6e-08 |
14 |
2 |
91965084 |
1.2e-08 |
1.6e-08 |
15 |
2 |
83230942 |
1.2e-08 |
1.6e-08 |
16 |
2 |
81586097 |
1.2e-08 |
1.6e-08 |
17 |
2 |
83181570 |
1.2e-08 |
1.6e-08 |
18 |
2 |
78221452 |
1.2e-08 |
1.6e-08 |
19 |
2 |
61309027 |
1.2e-08 |
1.6e-08 |
20 |
2 |
66533130 |
1.2e-08 |
1.6e-08 |
21 |
2 |
33445071 |
1.2e-08 |
1.6e-08 |
22 |
2 |
37823149 |
1.2e-08 |
1.6e-08 |
X |
2 |
155549662 |
1.2e-08 |
1.6e-08 |
Y |
1 |
26350515 |
1.2e-08 |
1.6e-08 |
Mutation and recombination rates are in units of per bp and per generation.
Demographic Models
ID |
Description |
|---|---|
Ghost admixture into bonobos |
Ghost admixture into bonobos
Demographic model of ghost admixture into bonobos from Kuhlwilm et al. (2019) Supplementary Table S3 row 7. This model simulates four populations: western chimpanzees, central chimpanzees, bonobos, and a extinct ghost lineage. The ghost admixture event is modelled as a 1.7% pulse from the ghost lineage to bonobos. Migration events among western chimpanzees, central chimpanzees, and bonobos are modelled as single generation pulses. Populatio size changes are also modelled.
Details
- ID:
BonoboGhost_4K19
- Description:
Ghost admixture into bonobos
- Num populations:
4
Populations
Index |
ID |
Sampling time |
Description |
|---|---|---|---|
0 |
western |
0 |
Contemporary Western Chimpanzees |
1 |
central |
0 |
Contemporary Central Chimpanzees |
2 |
bonobo |
0 |
Contemporary Bonobos |
3 |
ghost |
None |
Extinct ghost lineage |
Citations
Kuhlwilm et al. 2019, 2019. https://doi.org/10.1038/s41559-019-0881-7
Demographic Model parameters
Parameter Type (units) |
Value |
Description |
|---|---|---|
Population size |
10000 |
Ancestral pop. size |
Population size |
10000 |
Ghost pop. size |
Population size |
11600 |
Ancestral Bonobo-Chimpanzee pop. size |
Population size |
10200 |
Ancestral Common Chimpanzee pop. size |
Population size |
3700 |
Ancestral Bonobo pop. size |
Population size |
24900 |
Ancestral Central Chimpanzee pop. size |
Population size |
8000 |
Ancestral Western Chimpanzee pop. size |
Population size |
29100 |
Current Bonobo pop. size |
Population size |
65900 |
Current Central Chimpanzee pop. size |
Population size |
9200 |
Current Western Chimpanzee pop. size |
ADMIX percentage |
0.015 |
Amount of Central Chimpanzee in Western Chimpanzee |
ADMIX percentage |
0.005 |
Amount of Western Chimpanzee in Central Chimpanzee |
ADMIX percentage |
0.00125 |
Amount of Bonobo in Central Chimpanzee |
ADMIX percentage |
0.001 |
Amount of Central Chimpanzee in Bonobo |
ADMIX percentage |
0.02 |
Amount of Ghost pop. in Bonobo |
Migration rates (x10^-7) |
1 |
Bonobo-Common Chimpanzee migration |
Time (kya) |
3500 |
Ghost pop. split |
Time (kya) |
1990 |
Bonobo-Chimpanzee split |
Time (kya) |
1500 |
Bonobo-Common Chimpanzee migration start |
Time (kya) |
1200 |
Bonobo-Common Chimpanzee migration stop |
Time (kya) |
700 |
Western Chimpanzee split |
Time (kya) |
500 |
Ghost introgression into Bonobo |
Time (kya) |
155.05 |
Bonobo-Central Chimpanzee admixture |
Time (kya) |
100.1 |
Western-Central Chimpanzee admixture |
Time (kya) |
379 |
Central Chimpanzee resize |
Time (kya) |
308 |
Bonobo resize |
Time (kya) |
261 |
Western Chimpanzee resize |
Generation time (yrs.) |
25 |
Generation time |
Mutation rate |
1.2e-8 |
Per-base per-generation mutation rate |
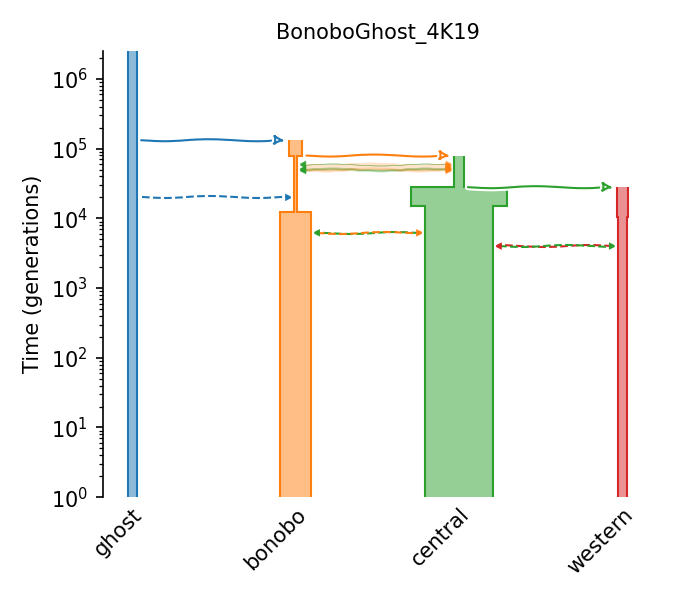
Papio anubis
- ID:
PapAnu
- Name:
Papio anubis
- Common name:
Olive baboon
- Generation time:
11 (Wu et. al., 2020)
- Ploidy:
2
- Population size:
335505 (Wall et. al., 2022)
Genome
- Genome assembly name:
Panubis1.0
ID |
Ploidy |
Length |
Recombination rate |
Mutation rate |
|---|---|---|---|---|
1 |
2 |
218172882 |
9.92638e-09 |
5.7e-09 |
2 |
2 |
193660750 |
9.60544e-09 |
5.7e-09 |
3 |
2 |
184919515 |
9.02238e-09 |
5.7e-09 |
4 |
2 |
182120902 |
9.82513e-09 |
5.7e-09 |
5 |
2 |
173900761 |
9.5798e-09 |
5.7e-09 |
6 |
2 |
167138247 |
1.04979e-08 |
5.7e-09 |
7 |
2 |
161768468 |
1.11888e-08 |
5.7e-09 |
8 |
2 |
140274886 |
1.10899e-08 |
5.7e-09 |
9 |
2 |
127591819 |
1.13288e-08 |
5.7e-09 |
10 |
2 |
126462689 |
1.17532e-08 |
5.7e-09 |
11 |
2 |
125913696 |
1.18403e-08 |
5.7e-09 |
12 |
2 |
123343450 |
1.0824e-08 |
5.7e-09 |
13 |
2 |
106849001 |
1.24677e-08 |
5.7e-09 |
14 |
2 |
106654974 |
1.27419e-08 |
5.7e-09 |
15 |
2 |
91985775 |
1.26084e-08 |
5.7e-09 |
16 |
2 |
91184193 |
1.47616e-08 |
5.7e-09 |
17 |
2 |
74525926 |
1.5241e-08 |
5.7e-09 |
18 |
2 |
72894408 |
1.36841e-08 |
5.7e-09 |
19 |
2 |
72123344 |
1.30374e-08 |
5.7e-09 |
20 |
2 |
50021108 |
1.6772e-08 |
5.7e-09 |
X |
2 |
142711496 |
1.18898e-08 |
5.7e-09 |
Y |
1 |
8309886 |
0 |
5.7e-09 |
Mutation and recombination rates are in units of per bp and per generation.
Genetic Maps
ID |
Year |
Description |
|---|---|---|
2022 |
Pyrho inferred genetic map for Papio Anubis |
Pyrho_PAnubis1_0
These estimates were obtained from a sample of Papio Anubis individuals from the colony housed at the Southwest National Primate Research Center (SNPRC).
Citations
Wall et. al., 2022. https://doi.org/10.1093/gbe/evac040
Demographic Models
ID |
Description |
|---|---|
SMC++ estimates of N(t) for Papio Anubis individuals |
SMC++ estimates of N(t) for Papio Anubis individuals
These estimates were obtained from a sample of Papio Anubis individuals from the colony housed at the Southwest National Primate Research Center (SNPRC). SMC++ was run with a subset of 36 individuals from the population.
Details
- ID:
SinglePopSMCpp_1W22
- Description:
SMC++ estimates of N(t) for Papio Anubis individuals
- Num populations:
1
Populations
Index |
ID |
Sampling time |
Description |
|---|---|---|---|
0 |
PAnubis_SNPRC |
0 |
Papio Anubis population from SNPRC |
Citations
Wall et. al., 2022. https://doi.org/10.1093/gbe/evac040
Demographic Model parameters
Parameter Type (units) |
Value |
Description |
|---|---|---|
Population size |
93362 |
Ancestral population size |
Population size |
55968 |
Pop. size during 1st time interval |
Population size |
72998 |
Pop. size during 2nd time interval |
Population size |
30714 |
Pop. size during 3rd time interval |
Population size |
41841 |
Pop. size during 4th time interval |
Population size |
51822 |
Pop. size during 5th time interval |
Population size |
120758 |
Pop. size during 6th time interval |
Population size |
335505 |
Pop. size during 7th time interval |
Time (yrs.) |
2046585 |
Begining of 1st time interval |
Time (yrs.) |
1219140 |
Begining of 2nd time interval |
Time (yrs.) |
782017 |
Begining of 3rd time interval |
Time (yrs.) |
432614 |
Begining of 4th time interval |
Time (yrs.) |
165305 |
Begining of 5th time interval |
Time (yrs.) |
5101 |
Begining of 6th time interval |
Time (yrs.) |
2434 |
Begining of 7th time interval |
Generation time (yrs.) |
11 |
Average generation interval |
Mutation rate |
5.7e-9 |
Per-base per-generation mutation rate |
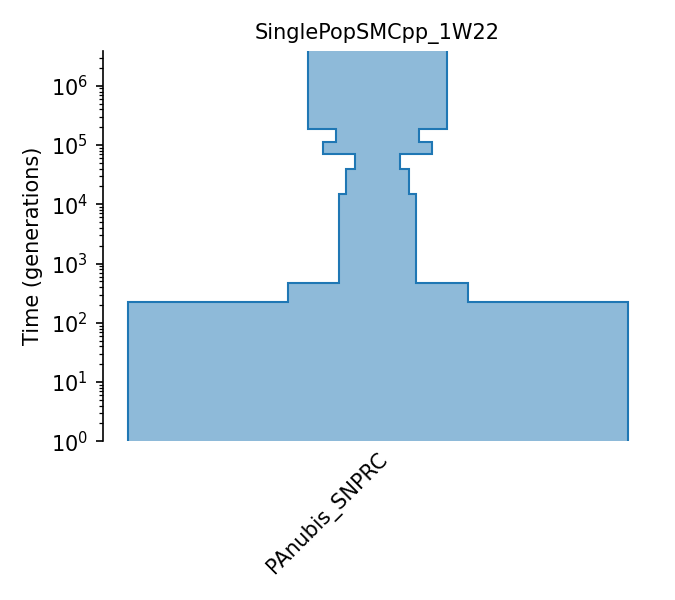
Phocoena sinus
- ID:
PhoSin
- Name:
Phocoena sinus
- Common name:
Vaquita
- Generation time:
- Ploidy:
2
- Population size:
3500 (Robinson et al., 2022)
Genome
- Genome assembly name:
mPhoSin1.pri
ID |
Ploidy |
Length |
Recombination rate |
Mutation rate |
|---|---|---|---|---|
1 |
2 |
185845356 |
1e-08 |
5.83e-09 |
2 |
2 |
178563925 |
1e-08 |
5.83e-09 |
3 |
2 |
174291665 |
1e-08 |
5.83e-09 |
4 |
2 |
146127150 |
1e-08 |
5.83e-09 |
5 |
2 |
139762554 |
1e-08 |
5.83e-09 |
6 |
2 |
115952311 |
1e-08 |
5.83e-09 |
7 |
2 |
115469292 |
1e-08 |
5.83e-09 |
8 |
2 |
110408561 |
1e-08 |
5.83e-09 |
9 |
2 |
106736052 |
1e-08 |
5.83e-09 |
10 |
2 |
102828027 |
1e-08 |
5.83e-09 |
11 |
2 |
104118372 |
1e-08 |
5.83e-09 |
12 |
2 |
90399378 |
1e-08 |
5.83e-09 |
13 |
2 |
90400161 |
1e-08 |
5.83e-09 |
14 |
2 |
89762611 |
1e-08 |
5.83e-09 |
15 |
2 |
88287594 |
1e-08 |
5.83e-09 |
16 |
2 |
85252673 |
1e-08 |
5.83e-09 |
17 |
2 |
79603858 |
1e-08 |
5.83e-09 |
18 |
2 |
79885847 |
1e-08 |
5.83e-09 |
19 |
2 |
59501331 |
1e-08 |
5.83e-09 |
20 |
2 |
58878645 |
1e-08 |
5.83e-09 |
21 |
2 |
35802323 |
1e-08 |
5.83e-09 |
X |
2 |
131664873 |
1e-08 |
5.83e-09 |
Mutation and recombination rates are in units of per bp and per generation.
Demographic Models
ID |
Description |
|---|---|
Vaquita two epoch model |
Vaquita two epoch model
A two-epoch demographic model estimated using dadi from the site frequency spectrum at putatively neutrally evolving regions of the genome identified as those located >10 kb from coding sequences which did not overlap with CpG islands. Population genomic data obtained from 20 individuals sequenced at mean coverage 60x. Robinson et al. (2022) reports several inferred models in Supp Table S2. This is the 2-epoch model inferred by dadi, which is also depicted in Main Figure 1E. Size changes from N_anc to N_curr in time T.
Details
- ID:
Vaquita2Epoch_1R22
- Description:
Vaquita two epoch model
- Num populations:
1
Populations
Index |
ID |
Sampling time |
Description |
|---|---|---|---|
0 |
Vaquita |
0 |
Vaquita (Phocoena sinus) |
Citations
Robinson et al., 2022. https://doi.org/10.1126/science.abm1742
Demographic Model parameters
Parameter Type (units) |
Value |
Description |
|---|---|---|
Population size |
4,485 |
Ancestral pop. size |
Population size |
2,807 |
Pop. size during second epoch |
Epoch Time (gen.) |
2,162 |
Start time of second epoch |
Generation time (yrs.) |
11.9 |
Average generation interval |
Mutation rate |
5.83e-9 |
Per-base per-generation mutation rate |
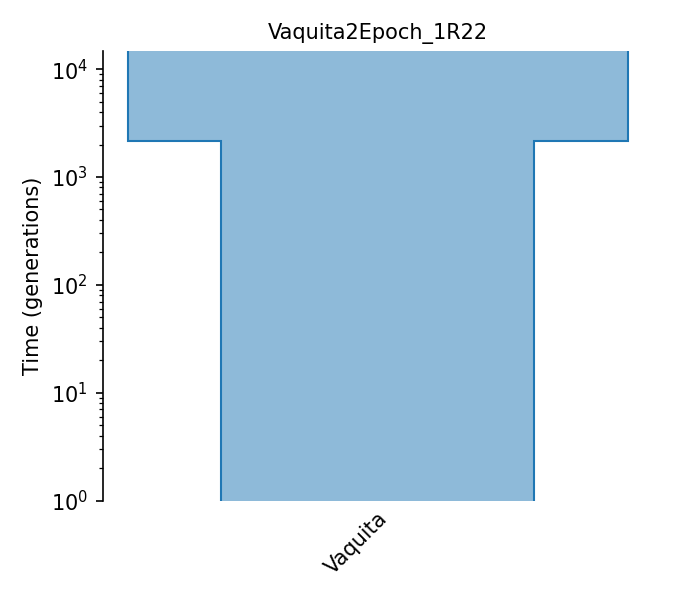
Annotations
ID |
Year |
Description |
|---|---|---|
2020 |
Vaquita exon annotations from Morin et al 2020 using NCBI’s pipeline |
|
2020 |
Vaquita CDS annotations from Morin et al 2020 using NCBI’s pipeline |
Phocoena_sinus.mPhoSin1.pri.110_exons
Vaquita exon annotations from Morin et al 2020 using NCBI’s pipeline
Citations
Morin et al, 2020. https://doi.org/10.1111/1755-0998.13284
Phocoena_sinus.mPhoSin1.pri.110_CDS
Vaquita CDS annotations from Morin et al 2020 using NCBI’s pipeline
Citations
Morin et al, 2020. https://doi.org/10.1111/1755-0998.13284
Distribution of Fitness Effects (DFEs)
ID |
Year |
Description |
|---|---|---|
2022 |
Deleterious Gamma DFE |
Gamma_R22
Deleterious Gamma DFE
Gamma-distributed deleterious DFE inferred by Robinson et al. (2022), and used in their simulations, from the synonymous and nonsynonymous SFS from Vaquita data, following the methods of Huber et al (2017).
Citations
Robinson et al., 2022. https://doi.org/10.1126/science.abm1742
DFE parameters
Proportion of mutations |
Distribution type |
Parameters |
Dominance |
|---|---|---|---|
30.0% |
Fixed s |
s = 0.000 |
h = 0.500 |
70.0% |
Gamma |
mean = -0.026, shape = 0.131 |
h = 0.000 on [0, -0.100); 0.010 on [-0.100, -0.010); 0.100 on [-0.010, -0.001); 0.400 on [-0.001, Inf) |
Pongo abelii
- ID:
PonAbe
- Name:
Pongo abelii
- Common name:
Sumatran orangutan
- Generation time:
25 (Wich et al., 2008)
- Ploidy:
2
- Population size:
17900.0 (Locke et al., 2011)
Genome
- Genome assembly name:
ponAbe3
ID |
Ploidy |
Length |
Recombination rate |
Mutation rate |
|---|---|---|---|---|
1 |
2 |
227913704 |
5.72097e-09 |
1.5e-08 |
2A |
2 |
109511694 |
6.74694e-09 |
1.5e-08 |
2B |
2 |
129937803 |
6.08833e-09 |
1.5e-08 |
3 |
2 |
193656255 |
5.77615e-09 |
1.5e-08 |
4 |
2 |
189387572 |
6.06176e-09 |
1.5e-08 |
5 |
2 |
179185813 |
5.87839e-09 |
1.5e-08 |
6 |
2 |
169501136 |
5.89605e-09 |
1.5e-08 |
7 |
2 |
145408105 |
6.82979e-09 |
1.5e-08 |
8 |
2 |
144036388 |
6.34313e-09 |
1.5e-08 |
9 |
2 |
112206110 |
7.04756e-09 |
1.5e-08 |
10 |
2 |
132178492 |
6.94812e-09 |
1.5e-08 |
11 |
2 |
128122151 |
5.79185e-09 |
1.5e-08 |
12 |
2 |
132184051 |
6.04316e-09 |
1.5e-08 |
13 |
2 |
98475126 |
6.40817e-09 |
1.5e-08 |
14 |
2 |
88963417 |
6.11075e-09 |
1.5e-08 |
15 |
2 |
82547911 |
6.6315e-09 |
1.5e-08 |
16 |
2 |
68237989 |
6.76066e-09 |
1.5e-08 |
17 |
2 |
75914007 |
8.01983e-09 |
1.5e-08 |
18 |
2 |
75923960 |
6.40065e-09 |
1.5e-08 |
19 |
2 |
57575784 |
9.09647e-09 |
1.5e-08 |
20 |
2 |
60841859 |
6.31424e-09 |
1.5e-08 |
21 |
2 |
34683425 |
7.58867e-09 |
1.5e-08 |
22 |
2 |
35308119 |
9.83628e-09 |
1.5e-08 |
X |
2 |
151242693 |
6.40288e-09 |
1.5e-08 |
MT |
1 |
16499 |
0 |
1.5e-08 |
Mutation and recombination rates are in units of per bp and per generation.
Genetic Maps
ID |
Year |
Description |
|---|---|---|
2017 |
From Nater et al. (2017) for Pongo abelii |
|
2017 |
From Nater et al. (2017) for Pongo pygmaeus |
NaterPA_PonAbe3
This genetic map is from the Nater et al. (2017) study, inferred using LDhat from n=15 whole-genome sequenced Sumatran orangutan individuals. See https://doi.org/10.1016/j.cub.2017.09.047 for more details. Lifted over from assembly PonAbe2 (as used in Nater et al.) to PonAbe3.
Citations
Nater et al., 2017. https://doi.org/10.1016/j.cub.2017.09.047
NaterPP_PonAbe3
This genetic map is from the Nater et al. (2017) study, inferred using LDhat from n=20 whole-genome sequenced Bornean orangutan individuals. See https://doi.org/10.1016/j.cub.2017.09.047 for more details. Lifted over from assembly PonAbe2 (as used in Nater et al.) to PonAbe3.
Citations
Nater et al., 2017. https://doi.org/10.1016/j.cub.2017.09.047
Demographic Models
ID |
Description |
|---|---|
Two population orangutan model |
Two population orangutan model
The two orang-utan species, Sumatran (Pongo abelii) and Bornean (Pongo pygmaeus) inferred from the joint-site frequency spectrum with ten individuals from each population. This model is an isolation-with- migration model, with exponential growth or decay in each population after the split. The Sumatran population grows in size, while the Bornean population slightly declines.
Details
- ID:
TwoSpecies_2L11
- Description:
Two population orangutan model
- Num populations:
2
Populations
Index |
ID |
Sampling time |
Description |
|---|---|---|---|
0 |
Bornean |
0 |
Pongo pygmaeus (Bornean) population |
1 |
Sumatran |
0 |
Pongo abelii (Sumatran) population |
Citations
Locke et al., 2011. http://doi.org/10.1038/nature09687
Demographic Model parameters
Parameter Type (units) |
Value |
Description |
|---|---|---|
Population size |
17,934 |
Ancestral pop. size |
Population size |
10,617 |
Pongo pygmaeus pop. size at split |
Population size |
7,317 |
Pongo abelii pop. size at split |
Population size |
8,805 |
Modern Pongo pygmaeus pop. size |
Population size |
37,661 |
Modern Pongo abelii pop. size |
Migration rate (x10^-5) |
1.10 |
Pongo abelii - Pongo pygmaeus migration rate (per gen.) |
Migration rate (x10^-5) |
0.67 |
Pongo pygmaeus - Pongo abelii migration rate (per gen.) |
Epoch Time (gen.) |
20,157 |
Species divergence time |
Generation time (yrs.) |
20 |
Generation time |
Mutation rate |
2e-8 |
Per-base per-generation mutation rate |
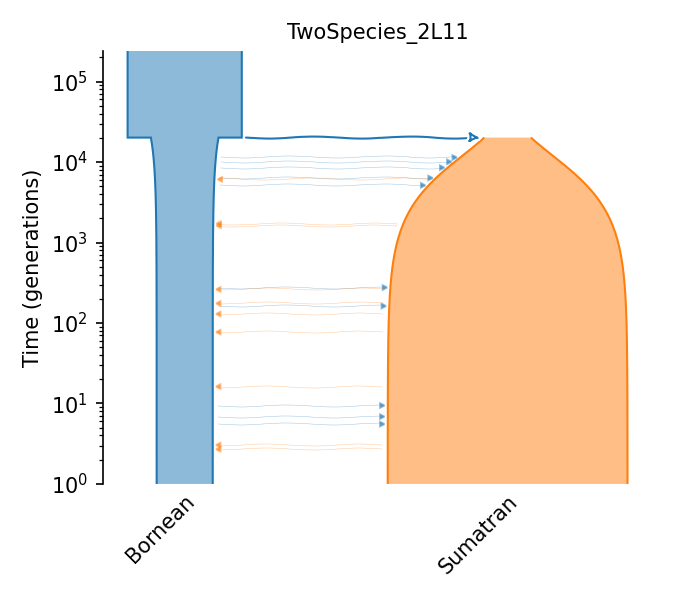
Rattus norvegicus
- ID:
RatNor
- Name:
Rattus norvegicus
- Common name:
Rat
- Generation time:
- Ploidy:
2
- Population size:
124000.0 (Deinum et al., 2015)
Genome
- Genome assembly name:
mRatBN7.2
ID |
Ploidy |
Length |
Recombination rate |
Mutation rate |
|---|---|---|---|---|
1 |
2 |
260522016 |
5e-09 |
2.96e-09 |
2 |
2 |
249053267 |
4.8e-09 |
2.96e-09 |
3 |
2 |
169034231 |
5.9e-09 |
2.96e-09 |
4 |
2 |
182687754 |
5.7e-09 |
2.96e-09 |
5 |
2 |
166875058 |
6.1e-09 |
2.96e-09 |
6 |
2 |
140994061 |
6e-09 |
2.96e-09 |
7 |
2 |
135012528 |
6.6e-09 |
2.96e-09 |
8 |
2 |
123900184 |
6.8e-09 |
2.96e-09 |
9 |
2 |
114175309 |
6.4e-09 |
2.96e-09 |
10 |
2 |
107211142 |
8.1e-09 |
2.96e-09 |
11 |
2 |
86241447 |
6.8e-09 |
2.96e-09 |
12 |
2 |
46669029 |
1.01e-08 |
2.96e-09 |
13 |
2 |
106807694 |
5.7e-09 |
2.96e-09 |
14 |
2 |
104886043 |
6.3e-09 |
2.96e-09 |
15 |
2 |
101769107 |
6.5e-09 |
2.96e-09 |
16 |
2 |
84729064 |
6.8e-09 |
2.96e-09 |
17 |
2 |
86533673 |
7.5e-09 |
2.96e-09 |
18 |
2 |
83828827 |
6.7e-09 |
2.96e-09 |
19 |
2 |
57337602 |
8.8e-09 |
2.96e-09 |
20 |
2 |
54435887 |
9.1e-09 |
2.96e-09 |
X |
2 |
152453651 |
3.7e-09 |
2.96e-09 |
Y |
1 |
18315841 |
0 |
2.96e-09 |
MT |
1 |
16313 |
0 |
4.44e-08 |
Mutation and recombination rates are in units of per bp and per generation.
Streptococcus agalactiae
- ID:
StrAga
- Name:
Streptococcus agalactiae
- Common name:
Group B Streptococcus
- Generation time:
0.0027397260273972603 (Savageau M.A., 1983)
- Ploidy:
1
- Population size:
140000 (Da Cunha et al, 2014)
Genome
- Genome assembly name:
GBCO_p1
- Bacterial recombination with tract length range:
120000
ID |
Ploidy |
Length |
Recombination rate |
Mutation rate |
|---|---|---|---|---|
1 |
1 |
2065074 |
1.53e-10 |
1.53e-09 |
Mutation and recombination rates are in units of per bp and per generation.
Sus scrofa
- ID:
SusScr
- Name:
Sus scrofa
- Common name:
Pig
- Generation time:
3.6 (Servanty et al., 2011)
- Ploidy:
2
- Population size:
270000 (Zhang et al., 2022)
Genome
- Genome assembly name:
Sscrofa11.1
ID |
Ploidy |
Length |
Recombination rate |
Mutation rate |
|---|---|---|---|---|
1 |
2 |
274330532 |
5.33525e-09 |
3.6e-09 |
2 |
2 |
151935994 |
8.60573e-09 |
3.6e-09 |
3 |
2 |
132848913 |
9.75114e-09 |
3.6e-09 |
4 |
2 |
130910915 |
9.7946e-09 |
3.6e-09 |
5 |
2 |
104526007 |
1.19926e-08 |
3.6e-09 |
6 |
2 |
170843587 |
8.78617e-09 |
3.6e-09 |
7 |
2 |
121844099 |
1.08878e-08 |
3.6e-09 |
8 |
2 |
138966237 |
8.92303e-09 |
3.6e-09 |
9 |
2 |
139512083 |
9.33751e-09 |
3.6e-09 |
10 |
2 |
69359453 |
1.65423e-08 |
3.6e-09 |
11 |
2 |
79169978 |
1.21451e-08 |
3.6e-09 |
12 |
2 |
61602749 |
1.69051e-08 |
3.6e-09 |
13 |
2 |
208334590 |
6.1628e-09 |
3.6e-09 |
14 |
2 |
141755446 |
8.72157e-09 |
3.6e-09 |
15 |
2 |
140412725 |
8.11447e-09 |
3.6e-09 |
16 |
2 |
79944280 |
1.14075e-08 |
3.6e-09 |
17 |
2 |
63494081 |
1.37799e-08 |
3.6e-09 |
18 |
2 |
55982971 |
1.36799e-08 |
3.6e-09 |
X |
2 |
125939595 |
9.41637e-09 |
3.6e-09 |
Y |
1 |
43547828 |
0 |
3.6e-09 |
MT |
1 |
16613 |
0 |
3.6e-09 |
Mutation and recombination rates are in units of per bp and per generation.
Generic models
In addition to the species-specific models listed in this catalog, stdpopsim offers
a number of generic demographic models that can be run with any species.
These are described in more detail in the API.
Simulations using these generic models must be run via the Python interface; see our
Python tutorial to learn how to do this.